Drill-downs in dashboards
Dashboards allows large datasets to be rolled up, so you can quickly and easily understand key information at a glance. For a further breakdown, use drill-downs to view specific details.
➤ You can see it in action here.
Example
A field services company schedules multiple inspections each day. Using a reporting dashboard, a manager can access an overview of completed inspections, then drill-down to quickly identify who performed a specific inspection.

Instructions
- Click the Configure tab and select 'Dashboards.'
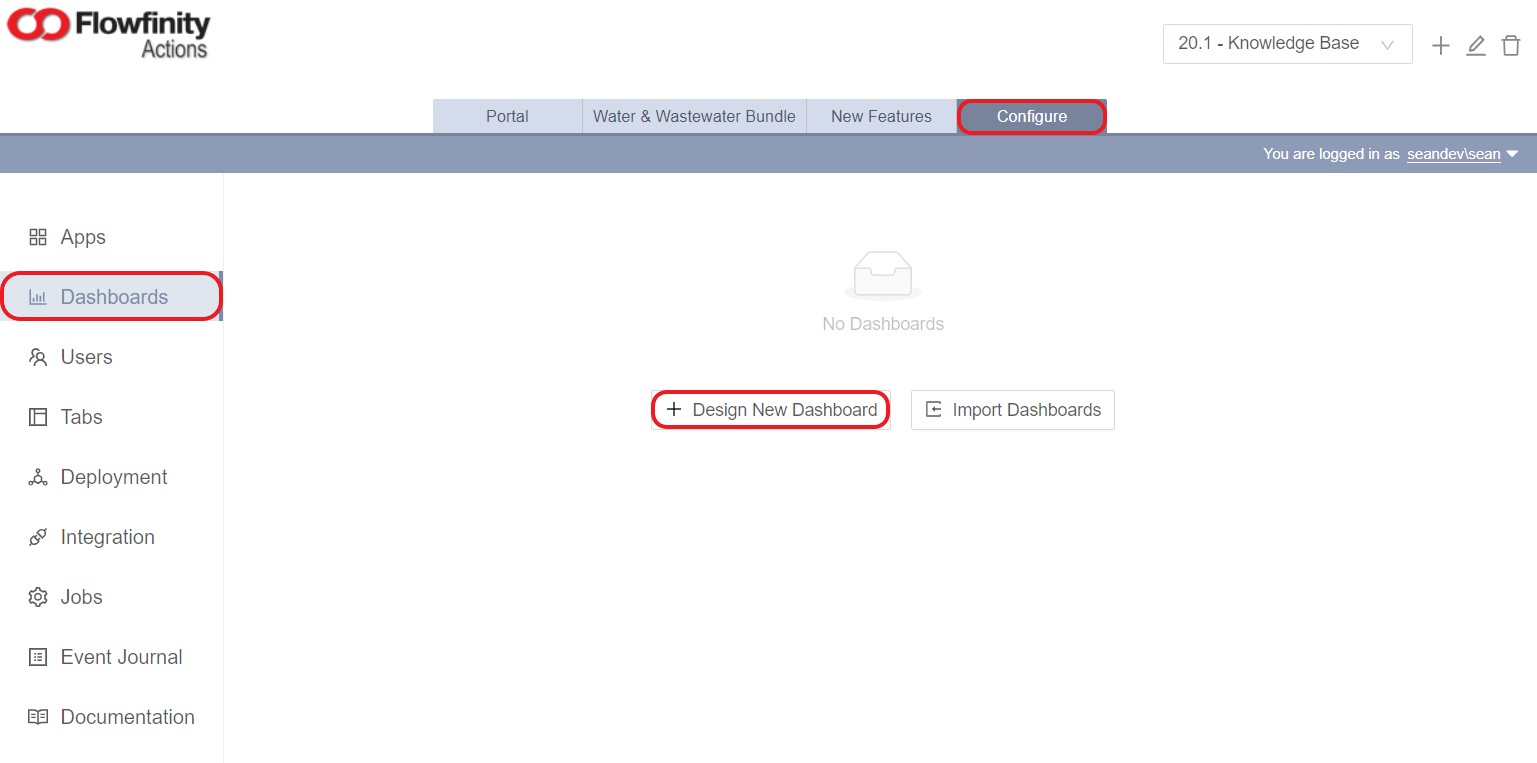
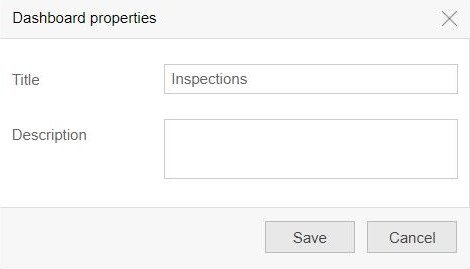
- Click 'Design New Dashboard' and give the dashboard an appropriate name (e.g., 'Inspections').
- Click Add Widget. Select 'Inspections' as the source app. Please note source applications must already exist in Flowfinity.
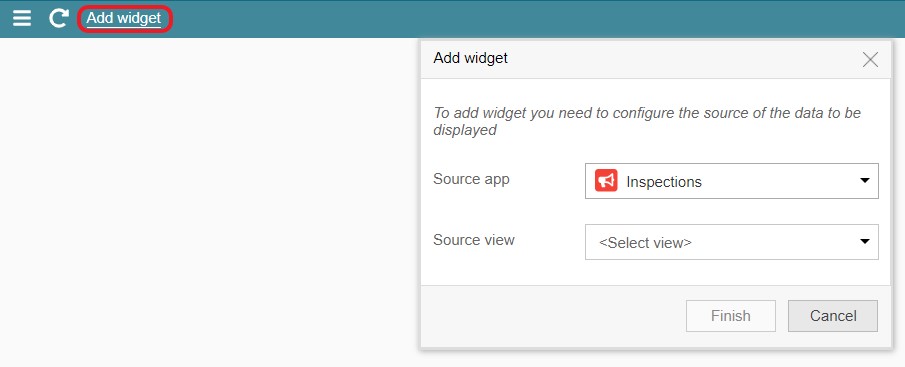
Select a 'Source view,' which is the View within the app that data will come from.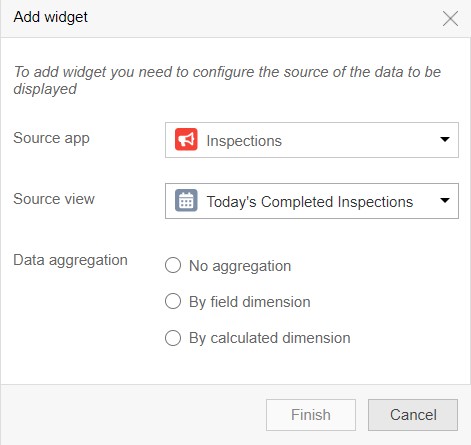
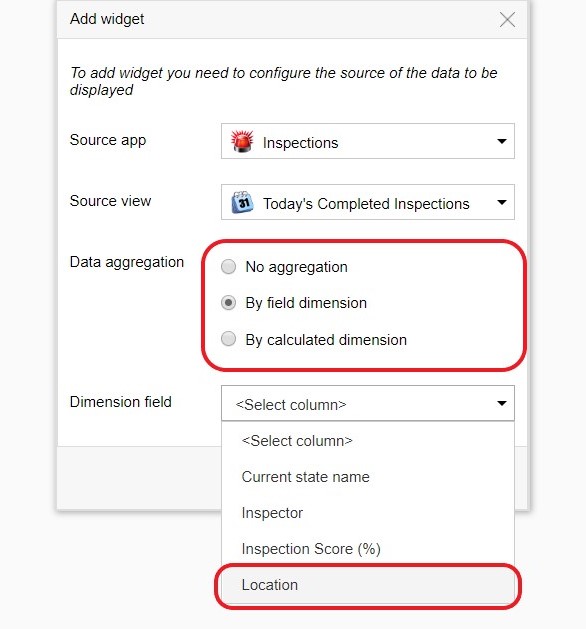
- Under 'Data aggregation,' select 'By field dimension.' This indicates the data should be grouped by a specific field. Set the 'Dimension field' to 'Location.'
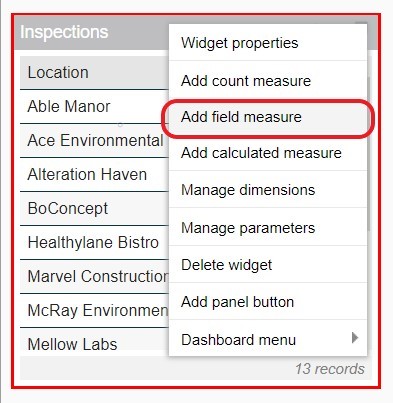
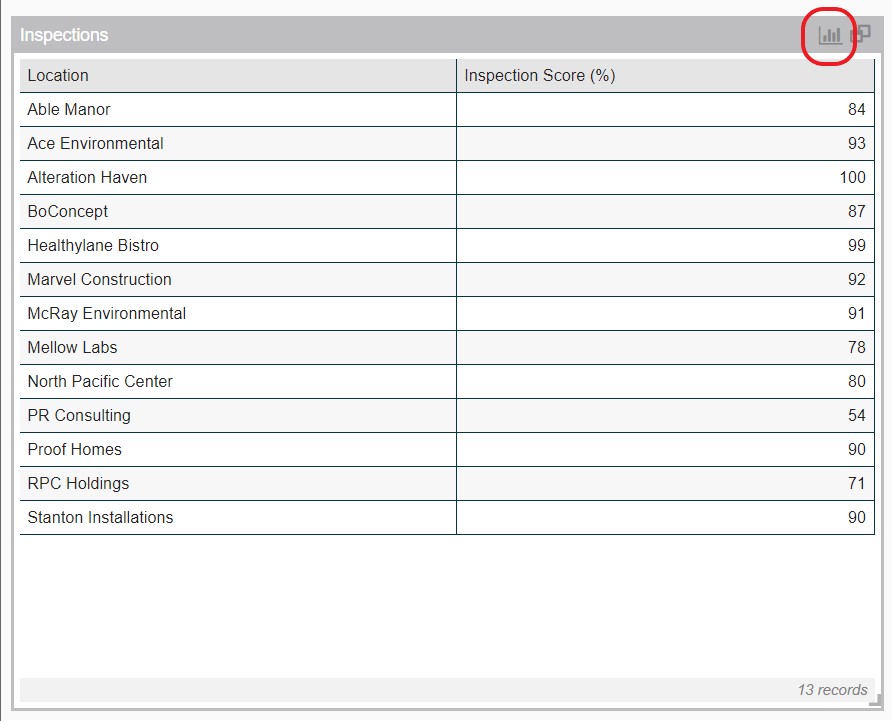
- Click 'Finish,' a table is then created based on the data selected in the previous steps.
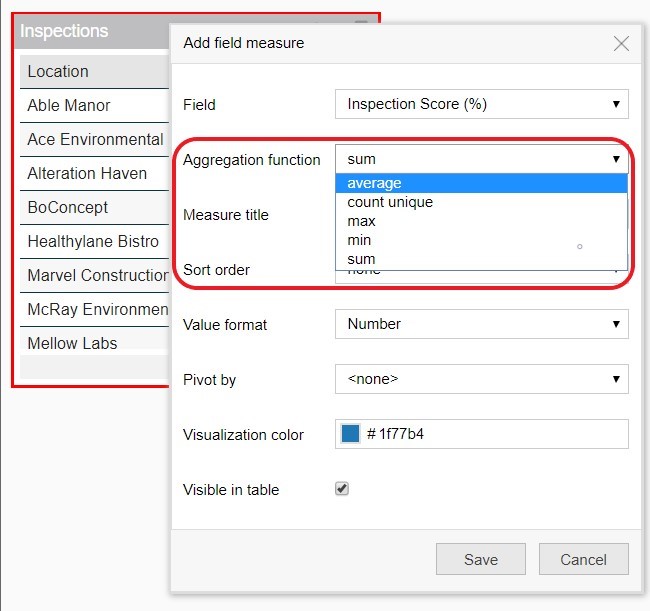
- Right-click the top gray bar, and select 'Add field measure.' Field measures use a single field to perform calculations based on existing data, such as summing up numerical fields.
- Use the dropdown to set the 'Field' as 'Inspection Score (%),' this will appear on the y-axis of the graph.
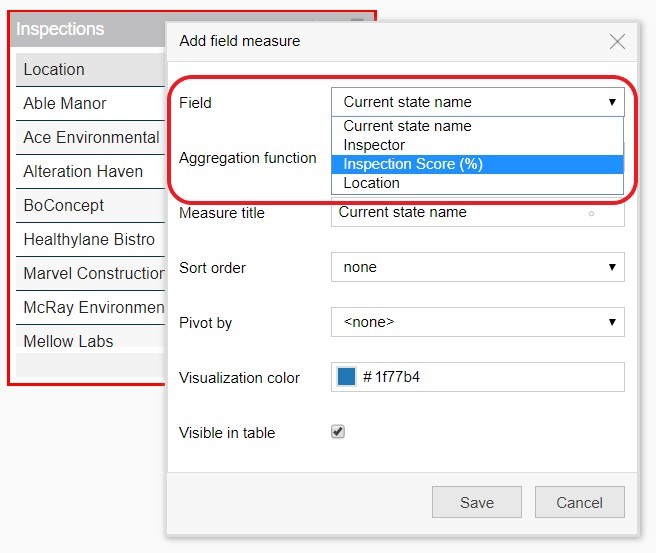
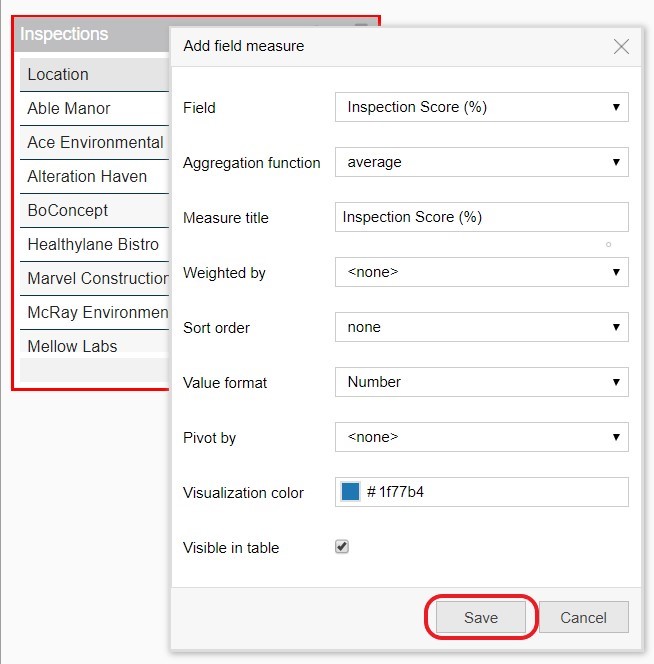
- Set 'Aggregation function' to 'average' and click save.
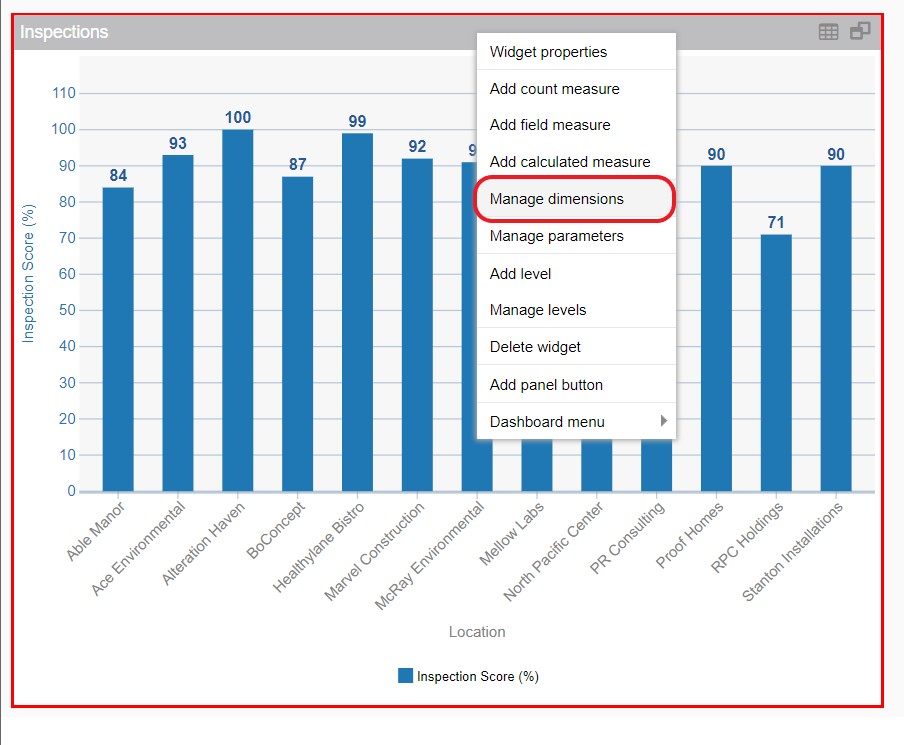
- Click and drag on the bottom right corner of the data table to expand the widget, and click the chart icon to see how the data looks as a chart.
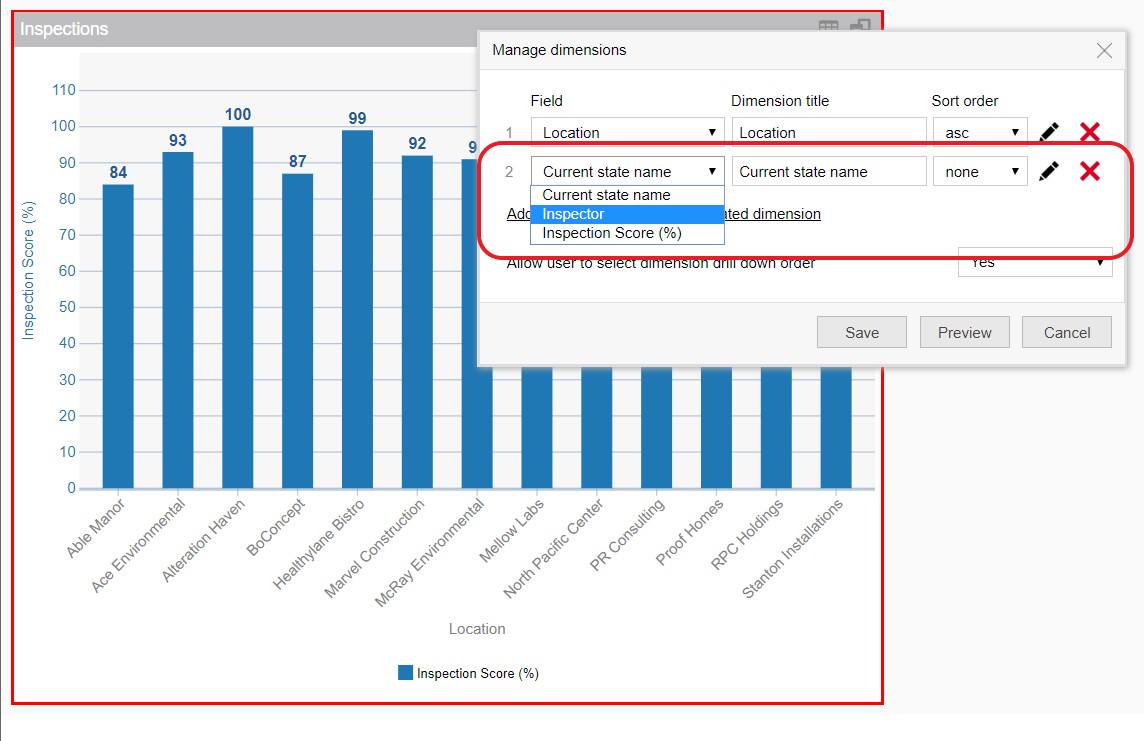
- For additional drill-down options, add more dimensions to your dashboard. To do this, right click on the gray bar and select 'Manage dimensions.'
- Click 'Add field dimension' and select 'Inspector.' Click 'save,' the graph will now allow your dashboard to drill-down into specific datasets.
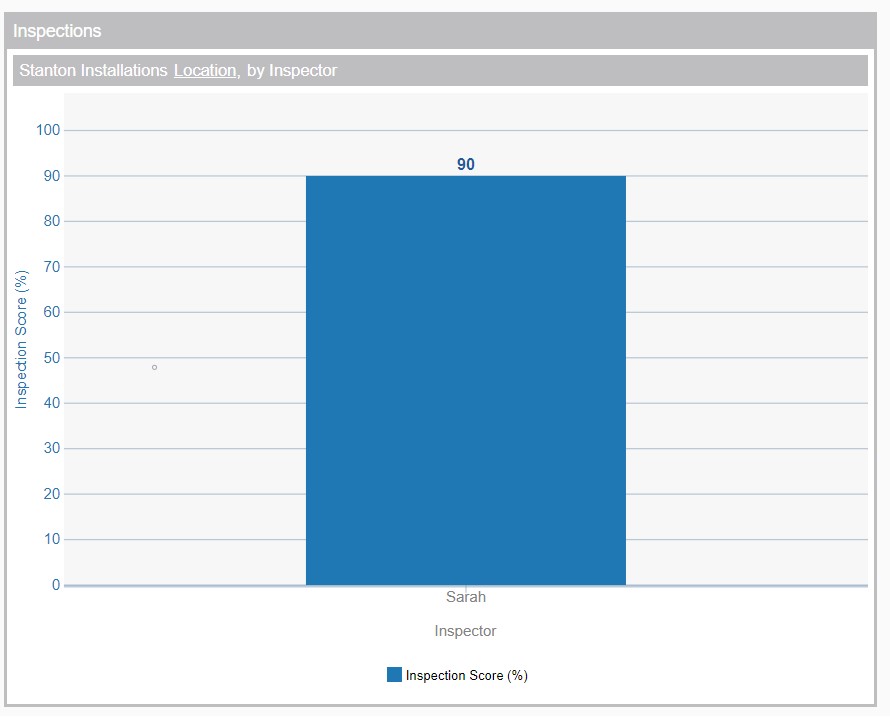
- To access the drill-down menu, click on any bar and extra options will appear. Now, we can identify the inspector who performed the inspection at a selected location.

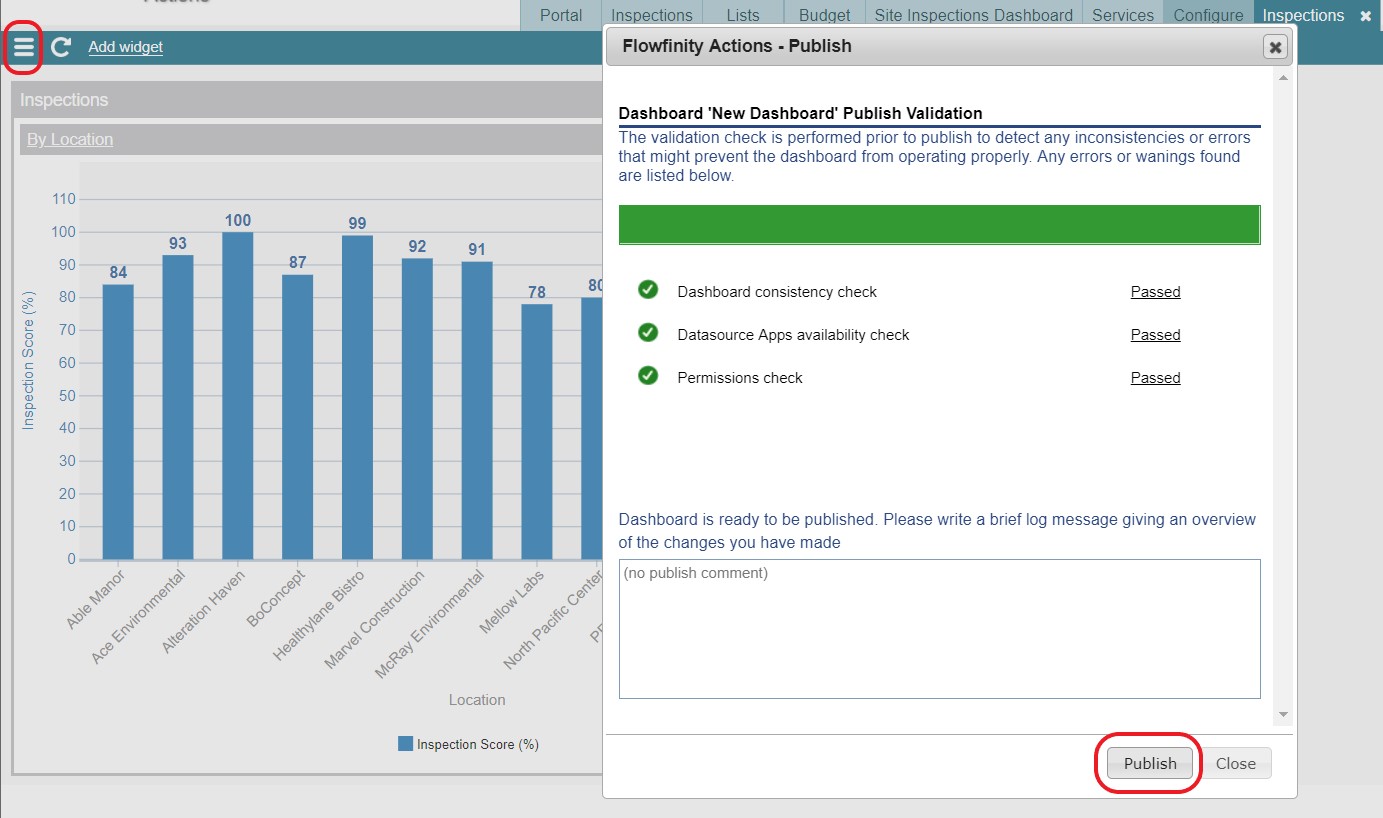
- Select the drop-down menu in the top left corner, click 'Publish' and the dashboard will undergo validation and will be ready for use.