Create heat maps
Color-coding is a powerful tool for quickly visualizing your data to spot trends, issues for action or areas that are exceptionally good. In Flowfinity you can use color-coding for individual fields, entire records, or nested list/grid fields.
Example 1: Color-coded Fields
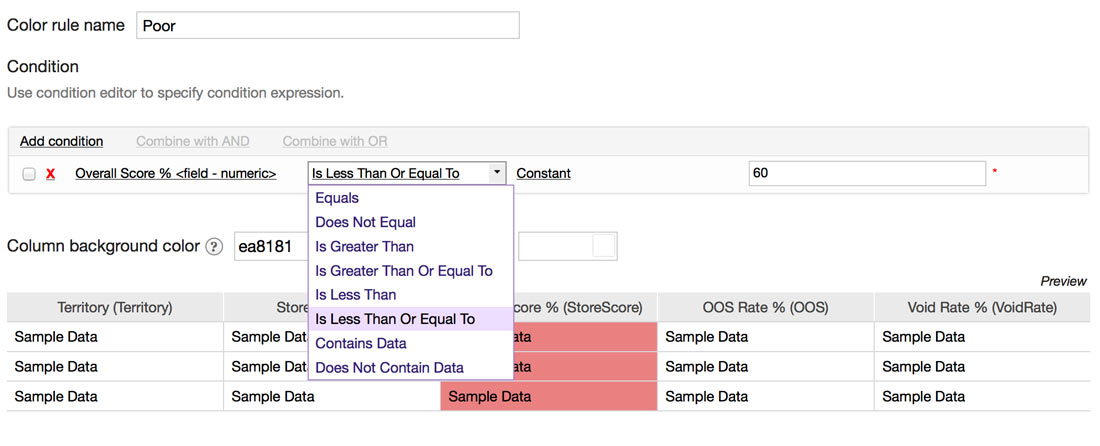
A Sales Operations Manager wants to review the results of store surveys submitted from the field to quickly identify any issues that need attention, or patterns of recurring issues. Business rules are set up so that individual fields are color-coded when values for out-of-stock rates, void rates, and store scores fall within certain ranges.
Instructions
- Customize the application
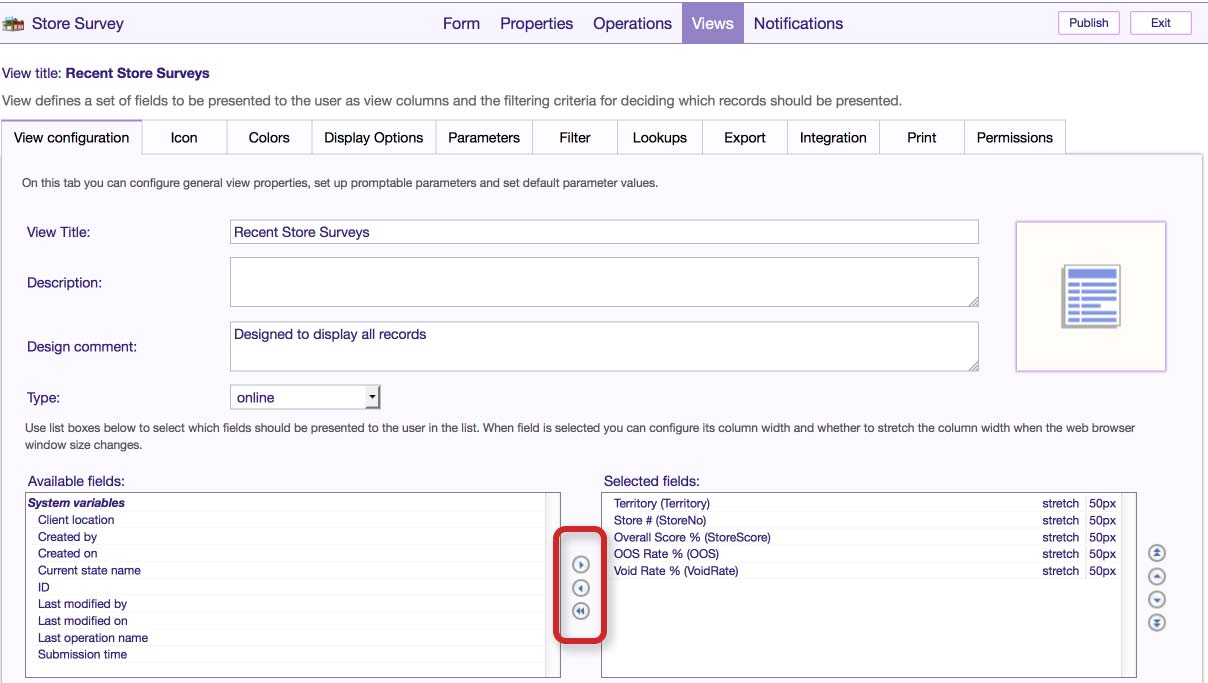
- In the Views section, click the 'Add View' button to create a new View.
-
Under the 'View configuration' tab, move fields that you would like to show in the view, from 'Available fields' to 'Selected fields'
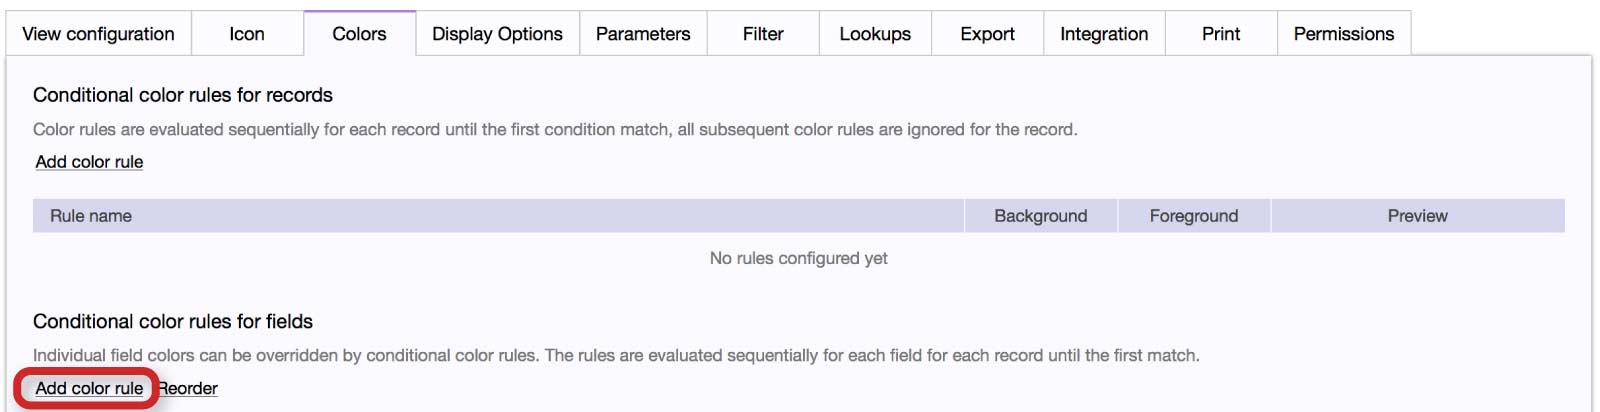
- Click on the Colors tab
- Under 'Conditional color rules for fields', click 'Add color rule'
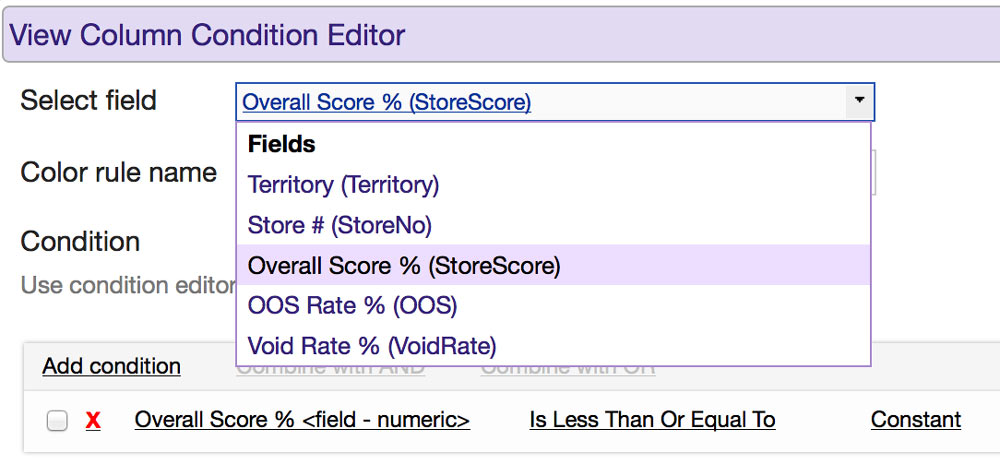
- Select the field to apply the color rule to
-
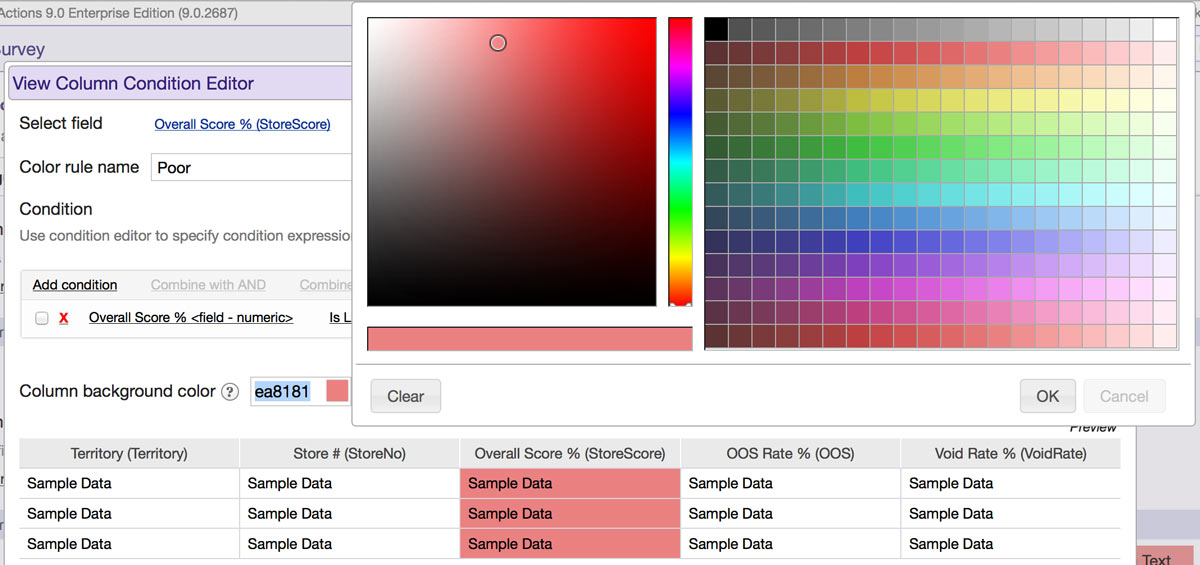
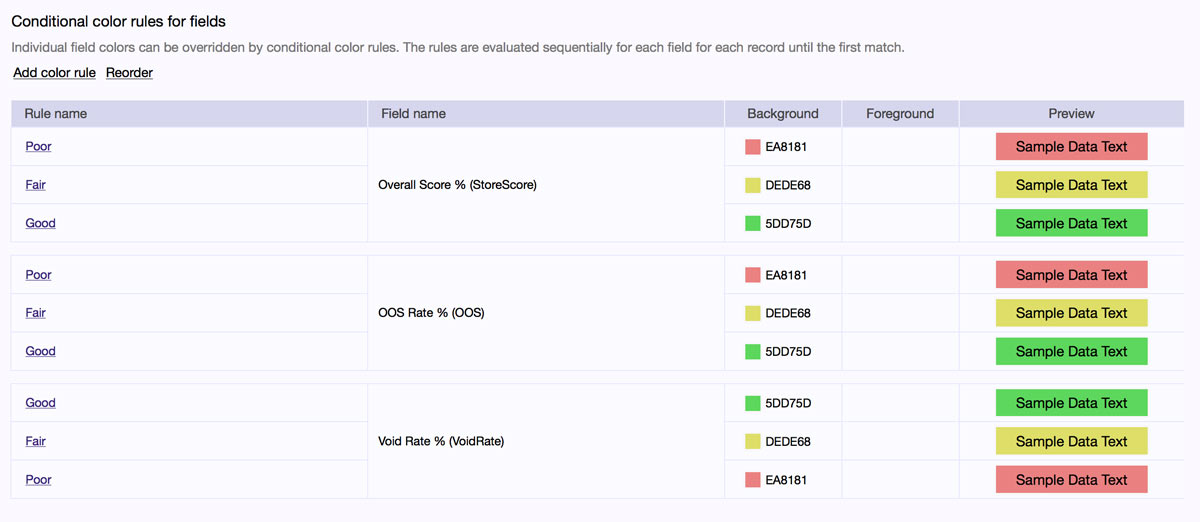
Name the color rule, and click 'Add condition' to set the condition(s) under which the field should appear in a specific color. In this example, the rule 'Poor' applies to all fields with an Overall Score less than or equal to 60%.
-
Select the background and text colors to display for that condition
-
Repeat the process for other conditions and fields. In this example yellow is used to identify 'Fair' results and green is used to show 'Good' results.
- Save the view and publish the application
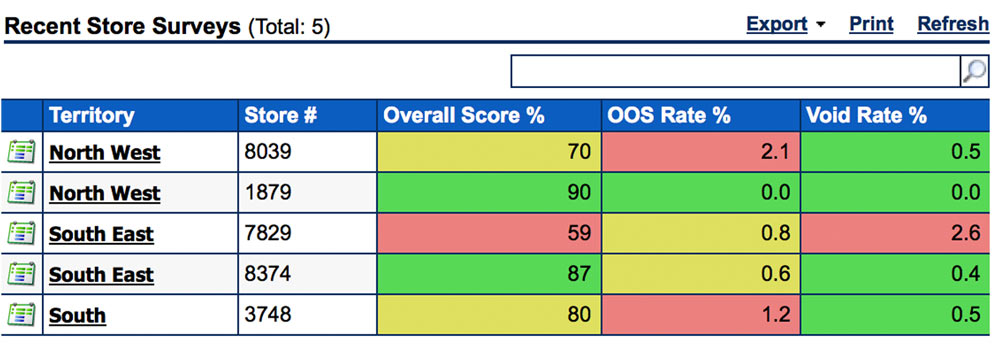
The View will then display your individual fields with each of the highlighted colors you selected, when the data meets the conditions you specified.
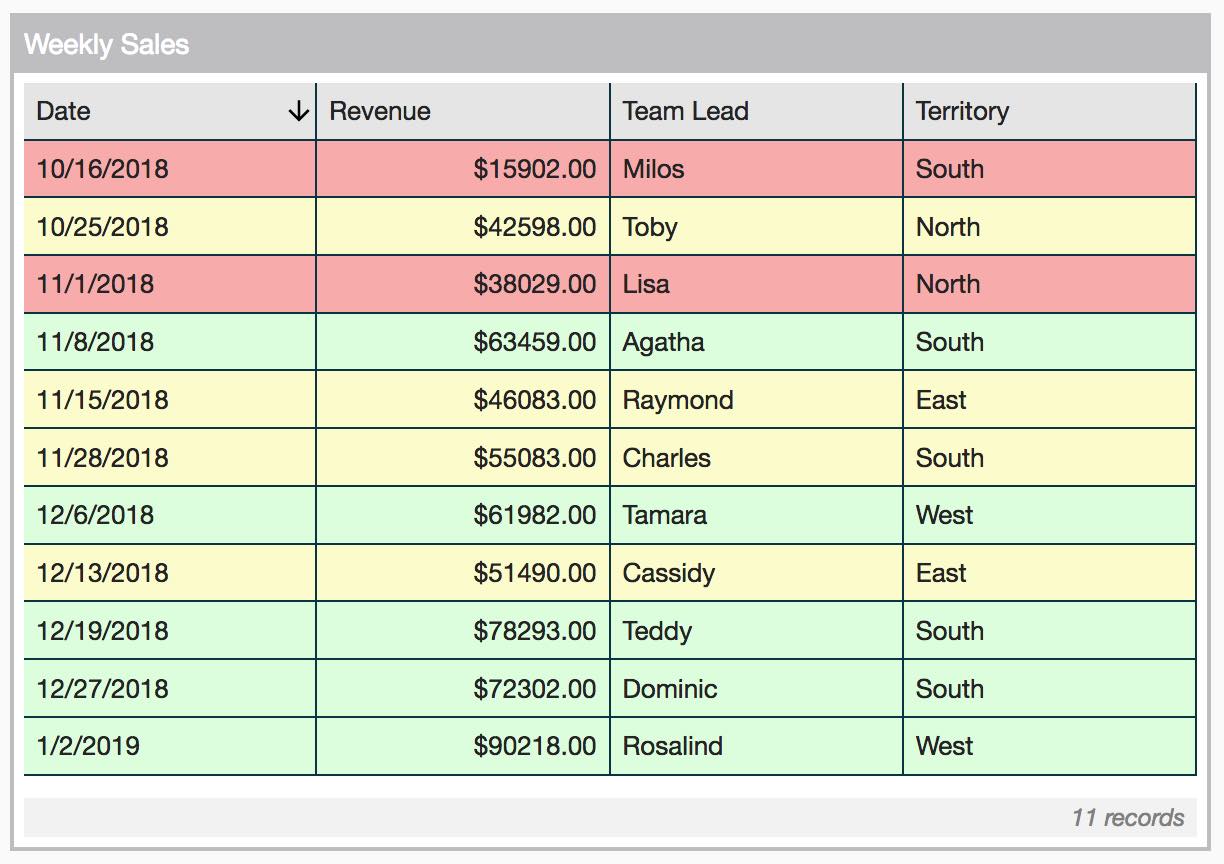
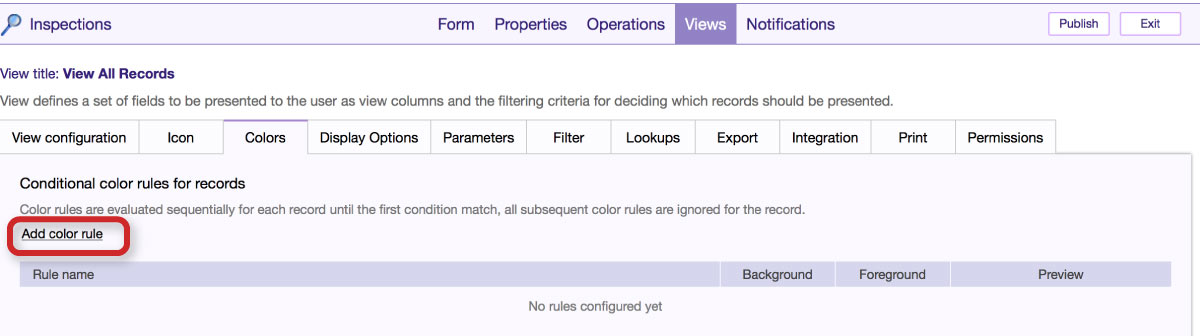
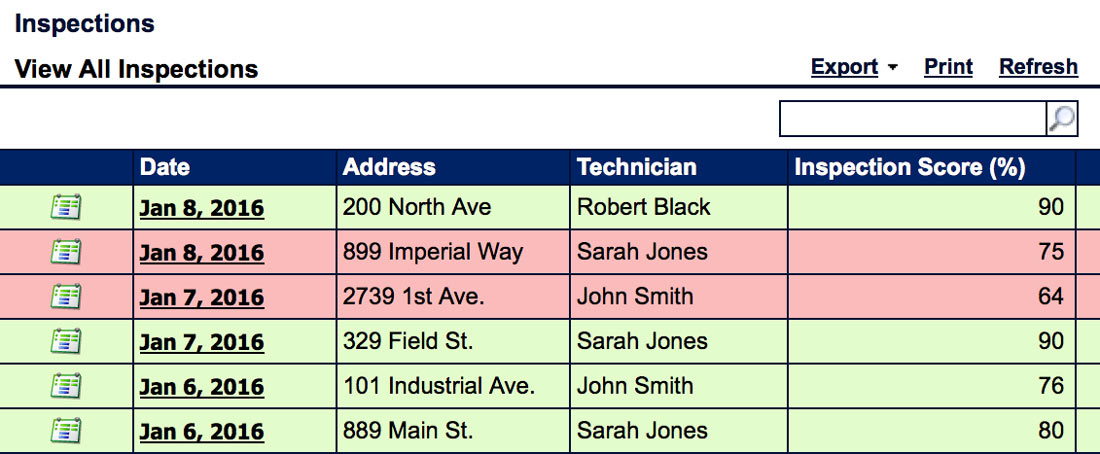
Example 2: Color-coded Records
An engineering company performs field inspections that result in either a pass or fail. The team lead wants to highlight which inspections have passed or failed in green or red.
Instructions
- Follow steps 1-4 from Example 1
-
Under 'Conditional color rules for records, click 'Add color rule'
-
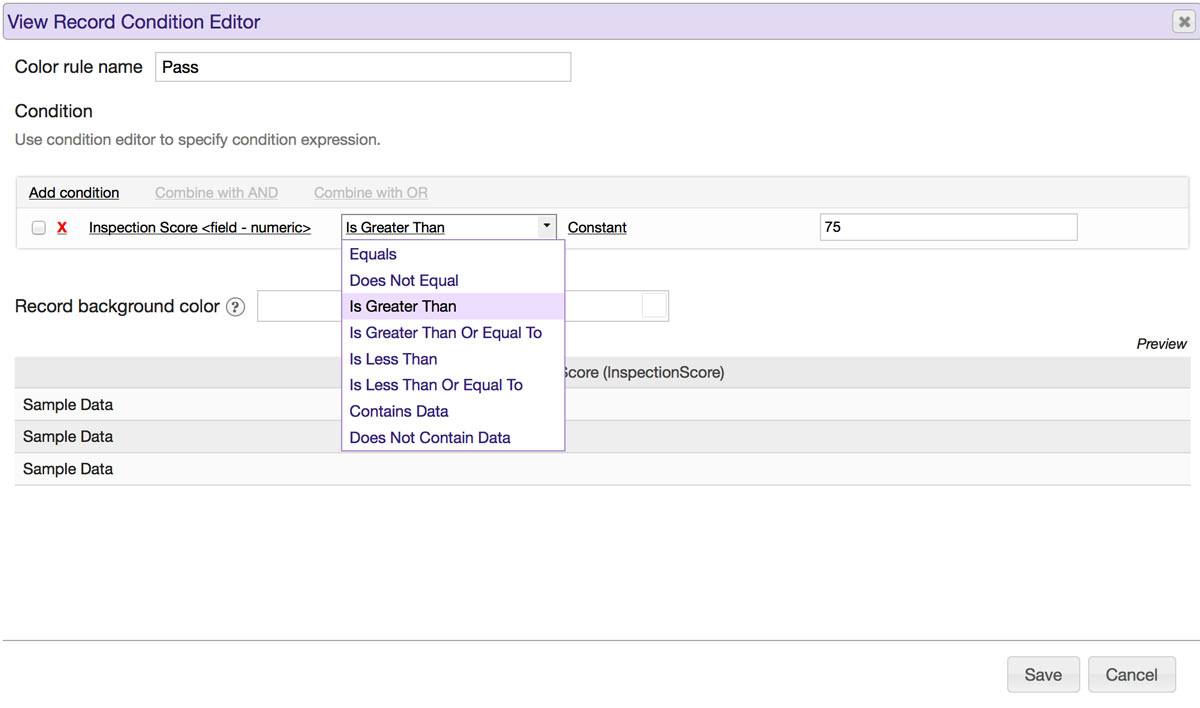
Name the color rule, and click 'Add condition' to set the conditions under which the field should appear in a specific color. In this example, the rule 'Pass' applies to all records with an Inspection Score greater than 75%.
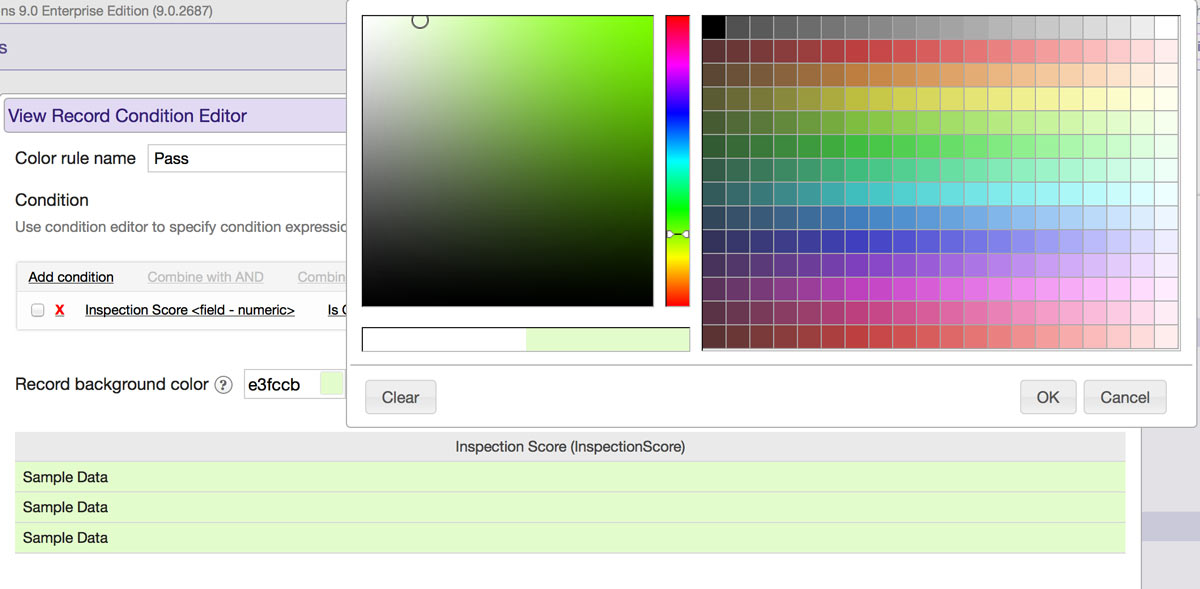
- Select the color for this condition
-
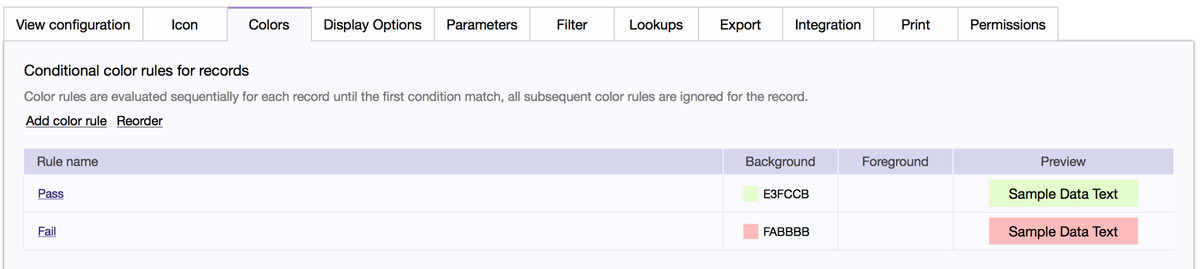
Repeat steps 2-4 for other conditions. In this example, create another condition 'Fail' for records with an Inspection Score less than or equal to 75%
- Save the view and publish the application
The View will then display each record with one of highlighted colors you selected, when the data meets the conditions you specified.
The color rules will also automatically apply to dashboards, within table widgets.