Launch record operations
In Flowfinity dashboards, you can not only view your business data, but also quickly identify what needs attention and take action straight from the dashboard. You can easily access a record, and launch the operations available such as reassigning tasks, updating item details, or sending reports to customers.
➤ You can see it in action here.
Example
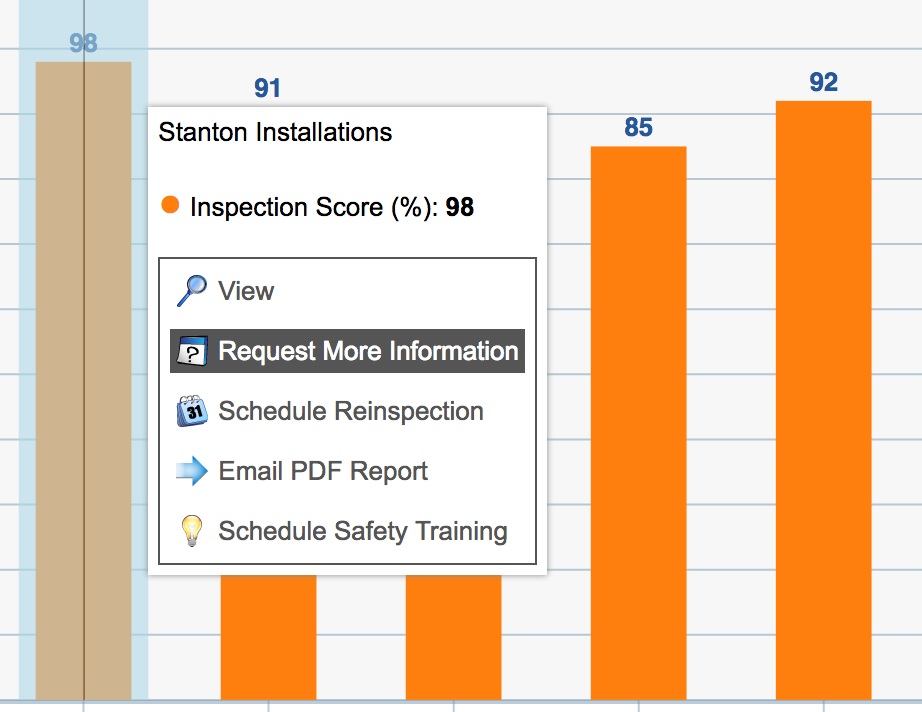
This dashboard is used to track inspections for the day. It allows you to launch operations that were built in the related inspections app, such as viewing, requesting more information, rescheduling, or emailing reports, directly from the dashboard. These operations can be completed without leaving the dashboard.
Instructions
Add a widget
-
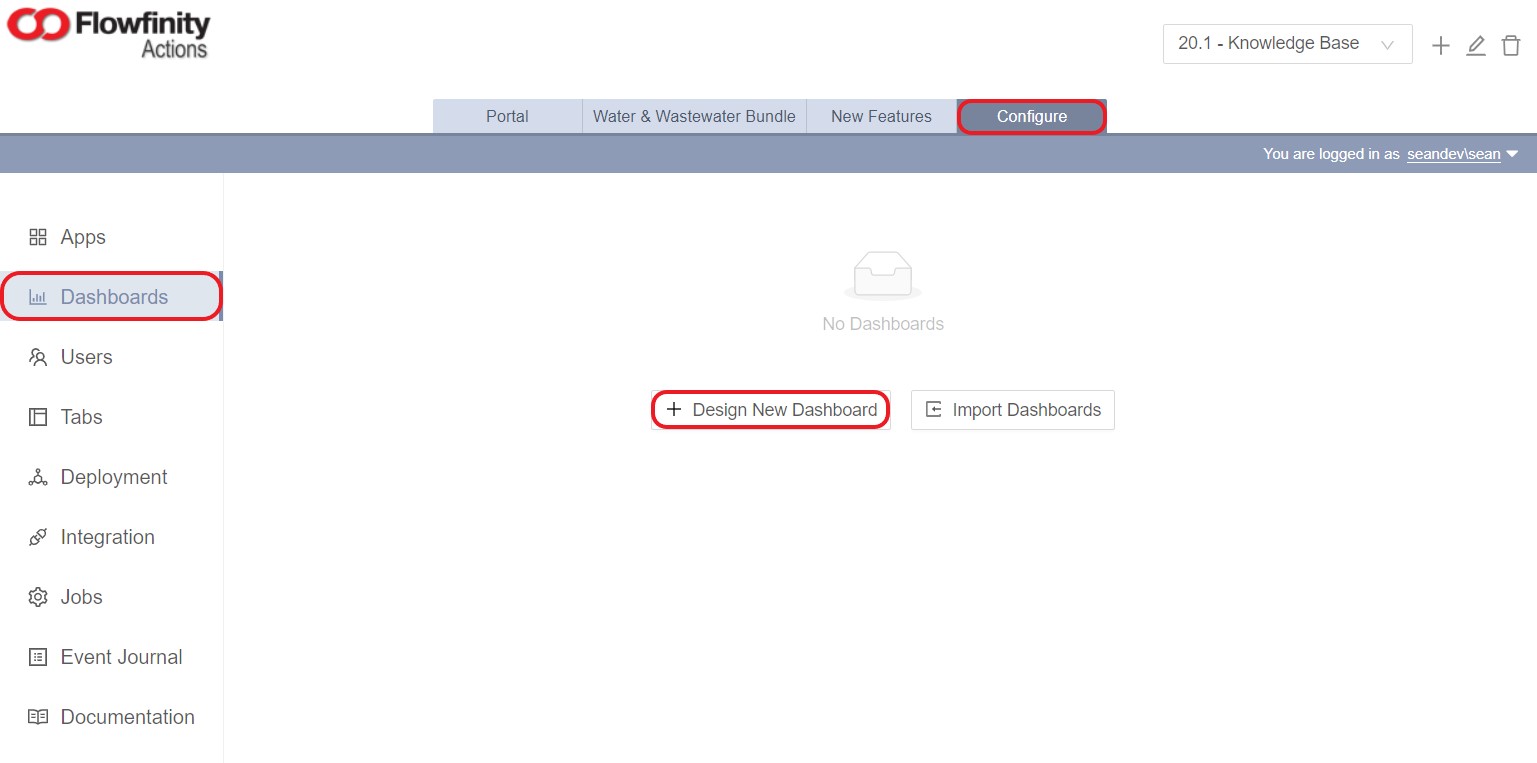
Go into the configure tab, dashboard section and click design new dashboard.
-
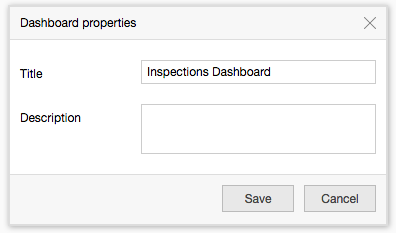
Name the dashboard and click save, then add a widget
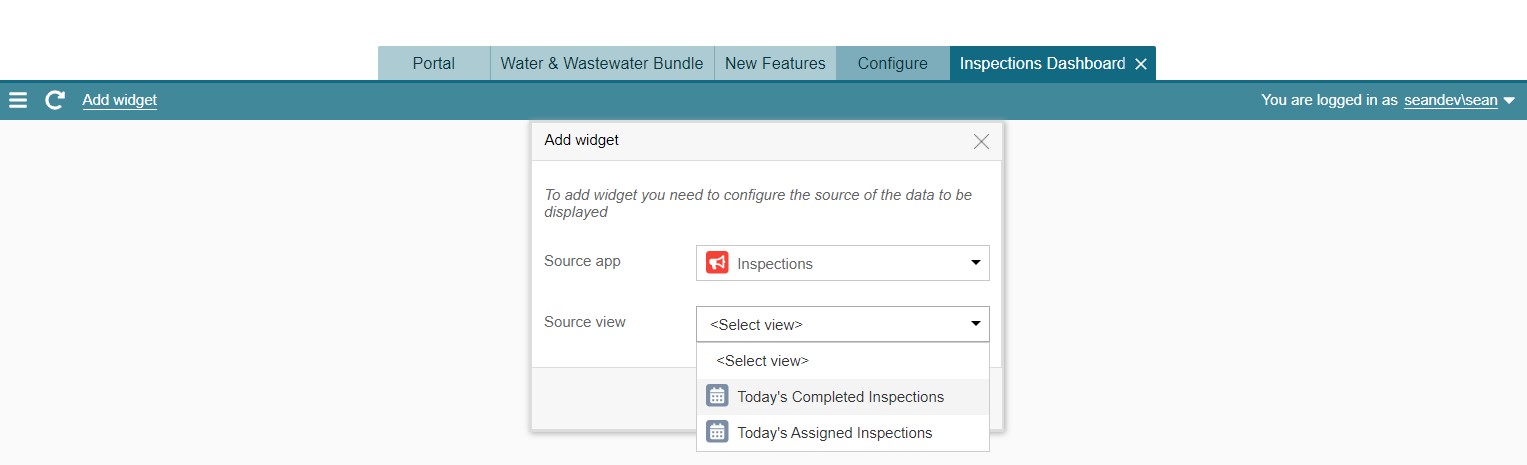
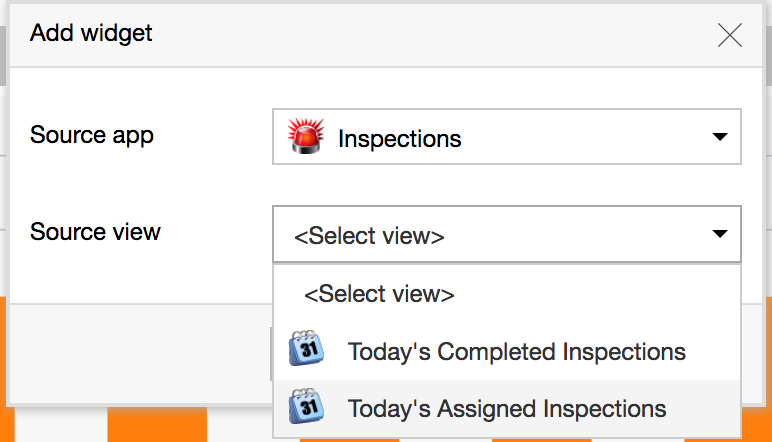
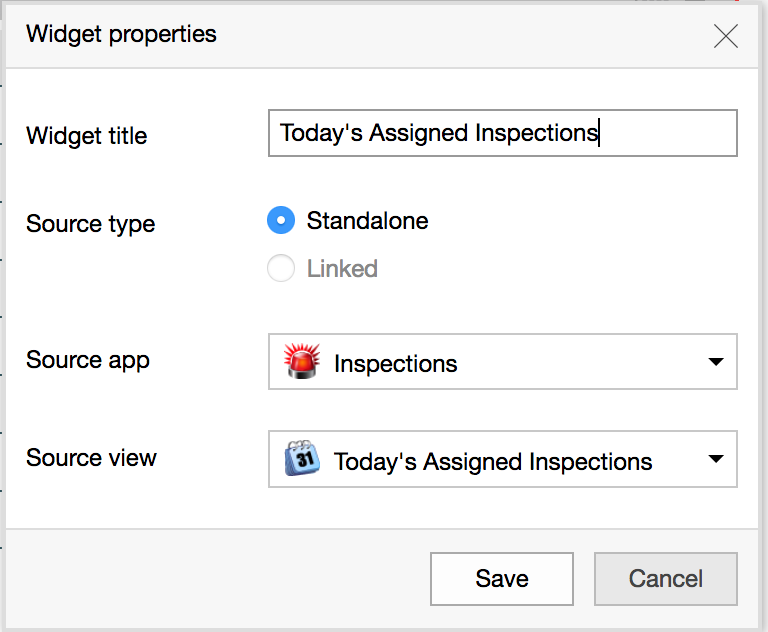
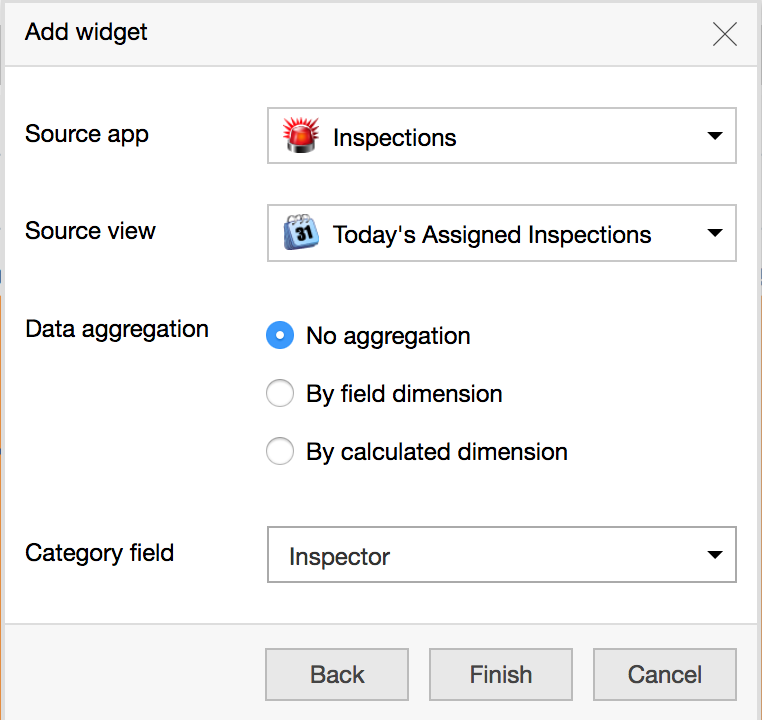
- Select the "Source app" where the data will be coming from, and relevant "Source view" which is the View from your application that you will be visualizing data from
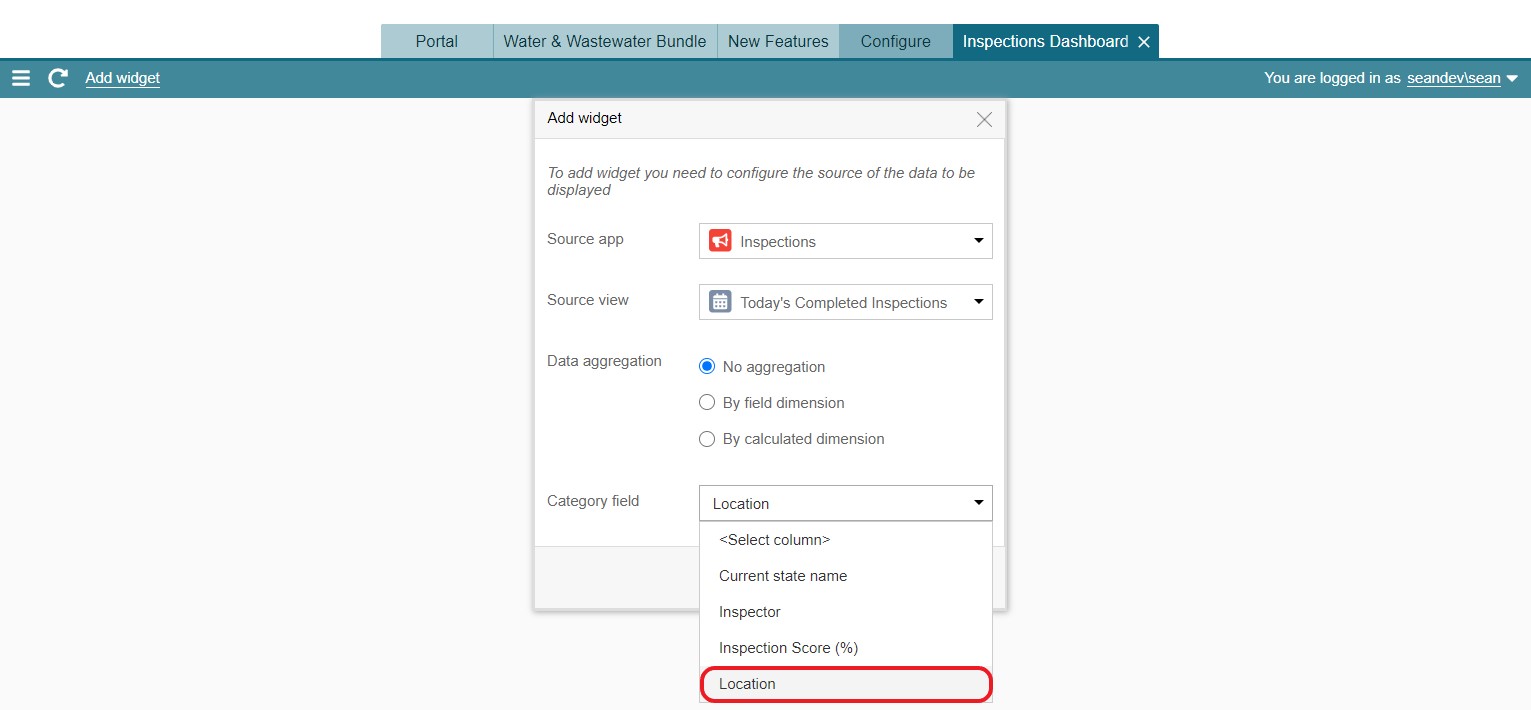
- Select "No aggregation" so that you can access each record's menu individually
-
Select a "Category field" to be displayed on the X-axis.
- Click "Finish".
-
Click and drag the bottom right corner to resize the widget, and the chart icon on the top right to display the data as a chart.
-
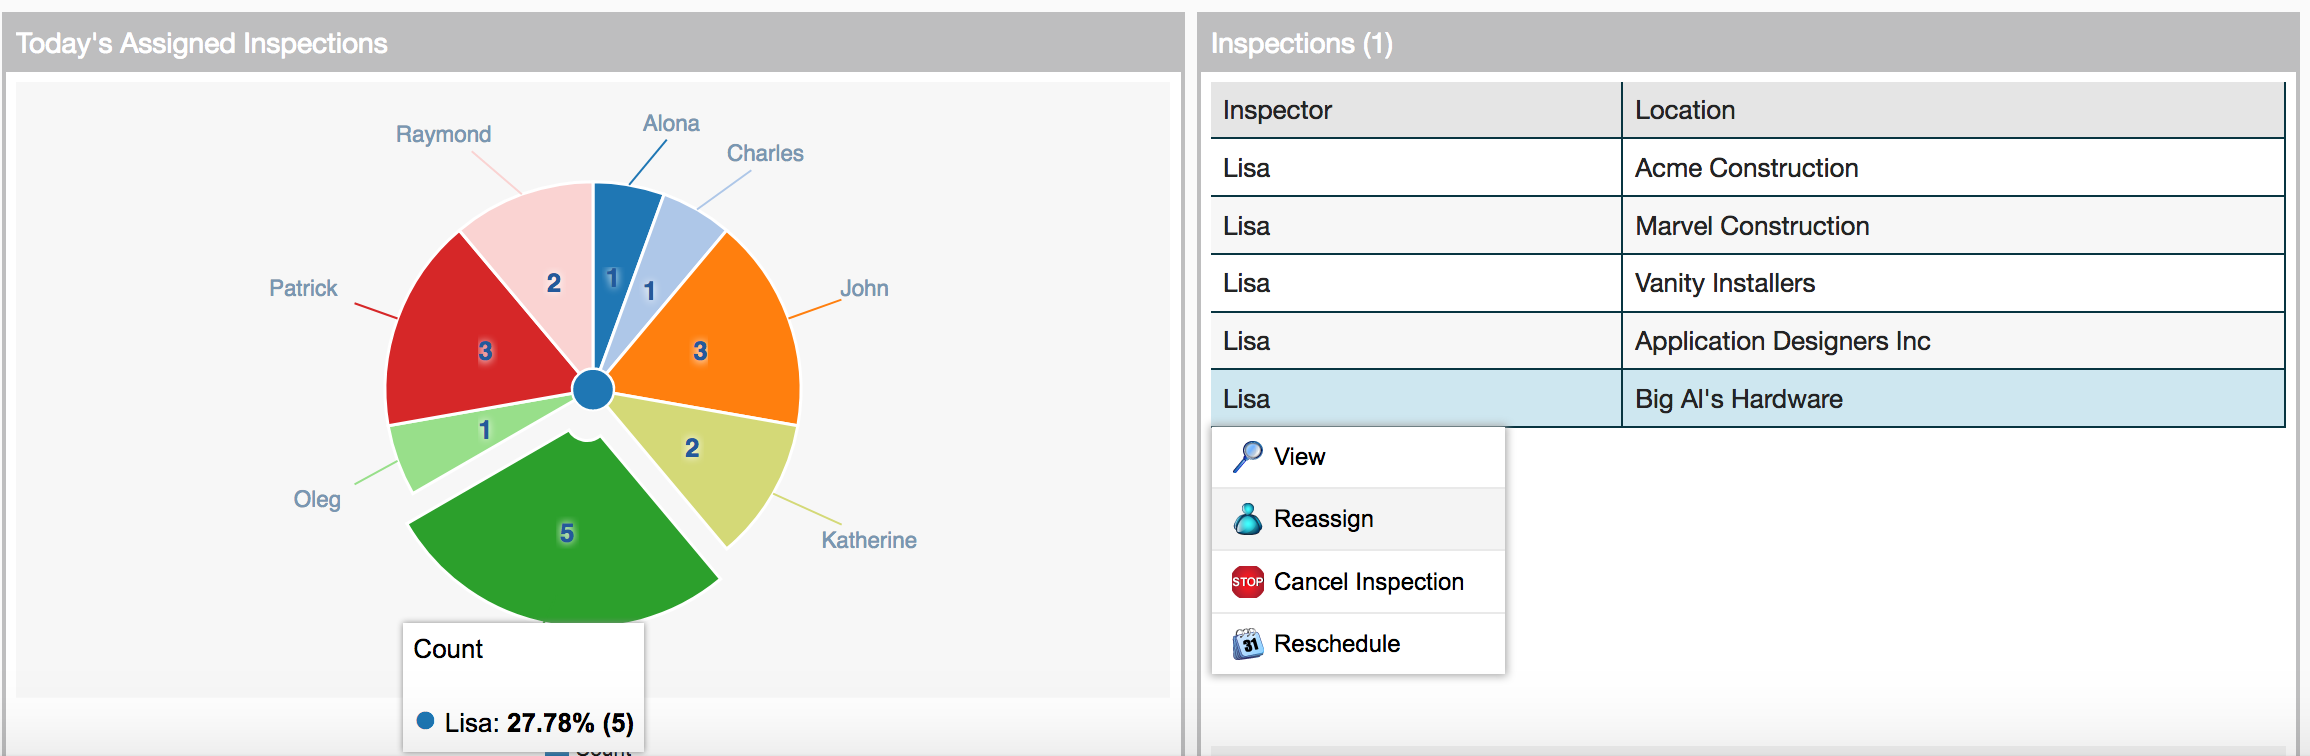
Click on any record to display the operations available for that record that were set up in the application editor


Add a reference line
-
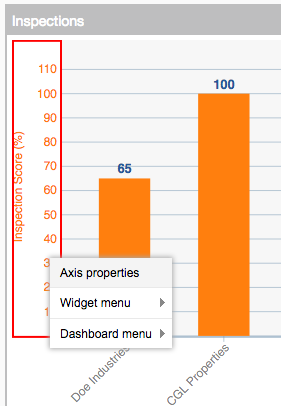
To add a reference line to the chart, right-click on the Axis and select "Axis properties"
-
Click "Add reference line"
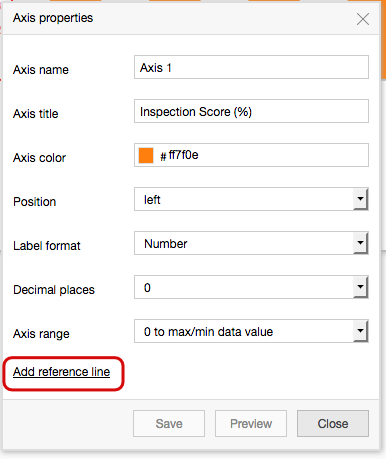
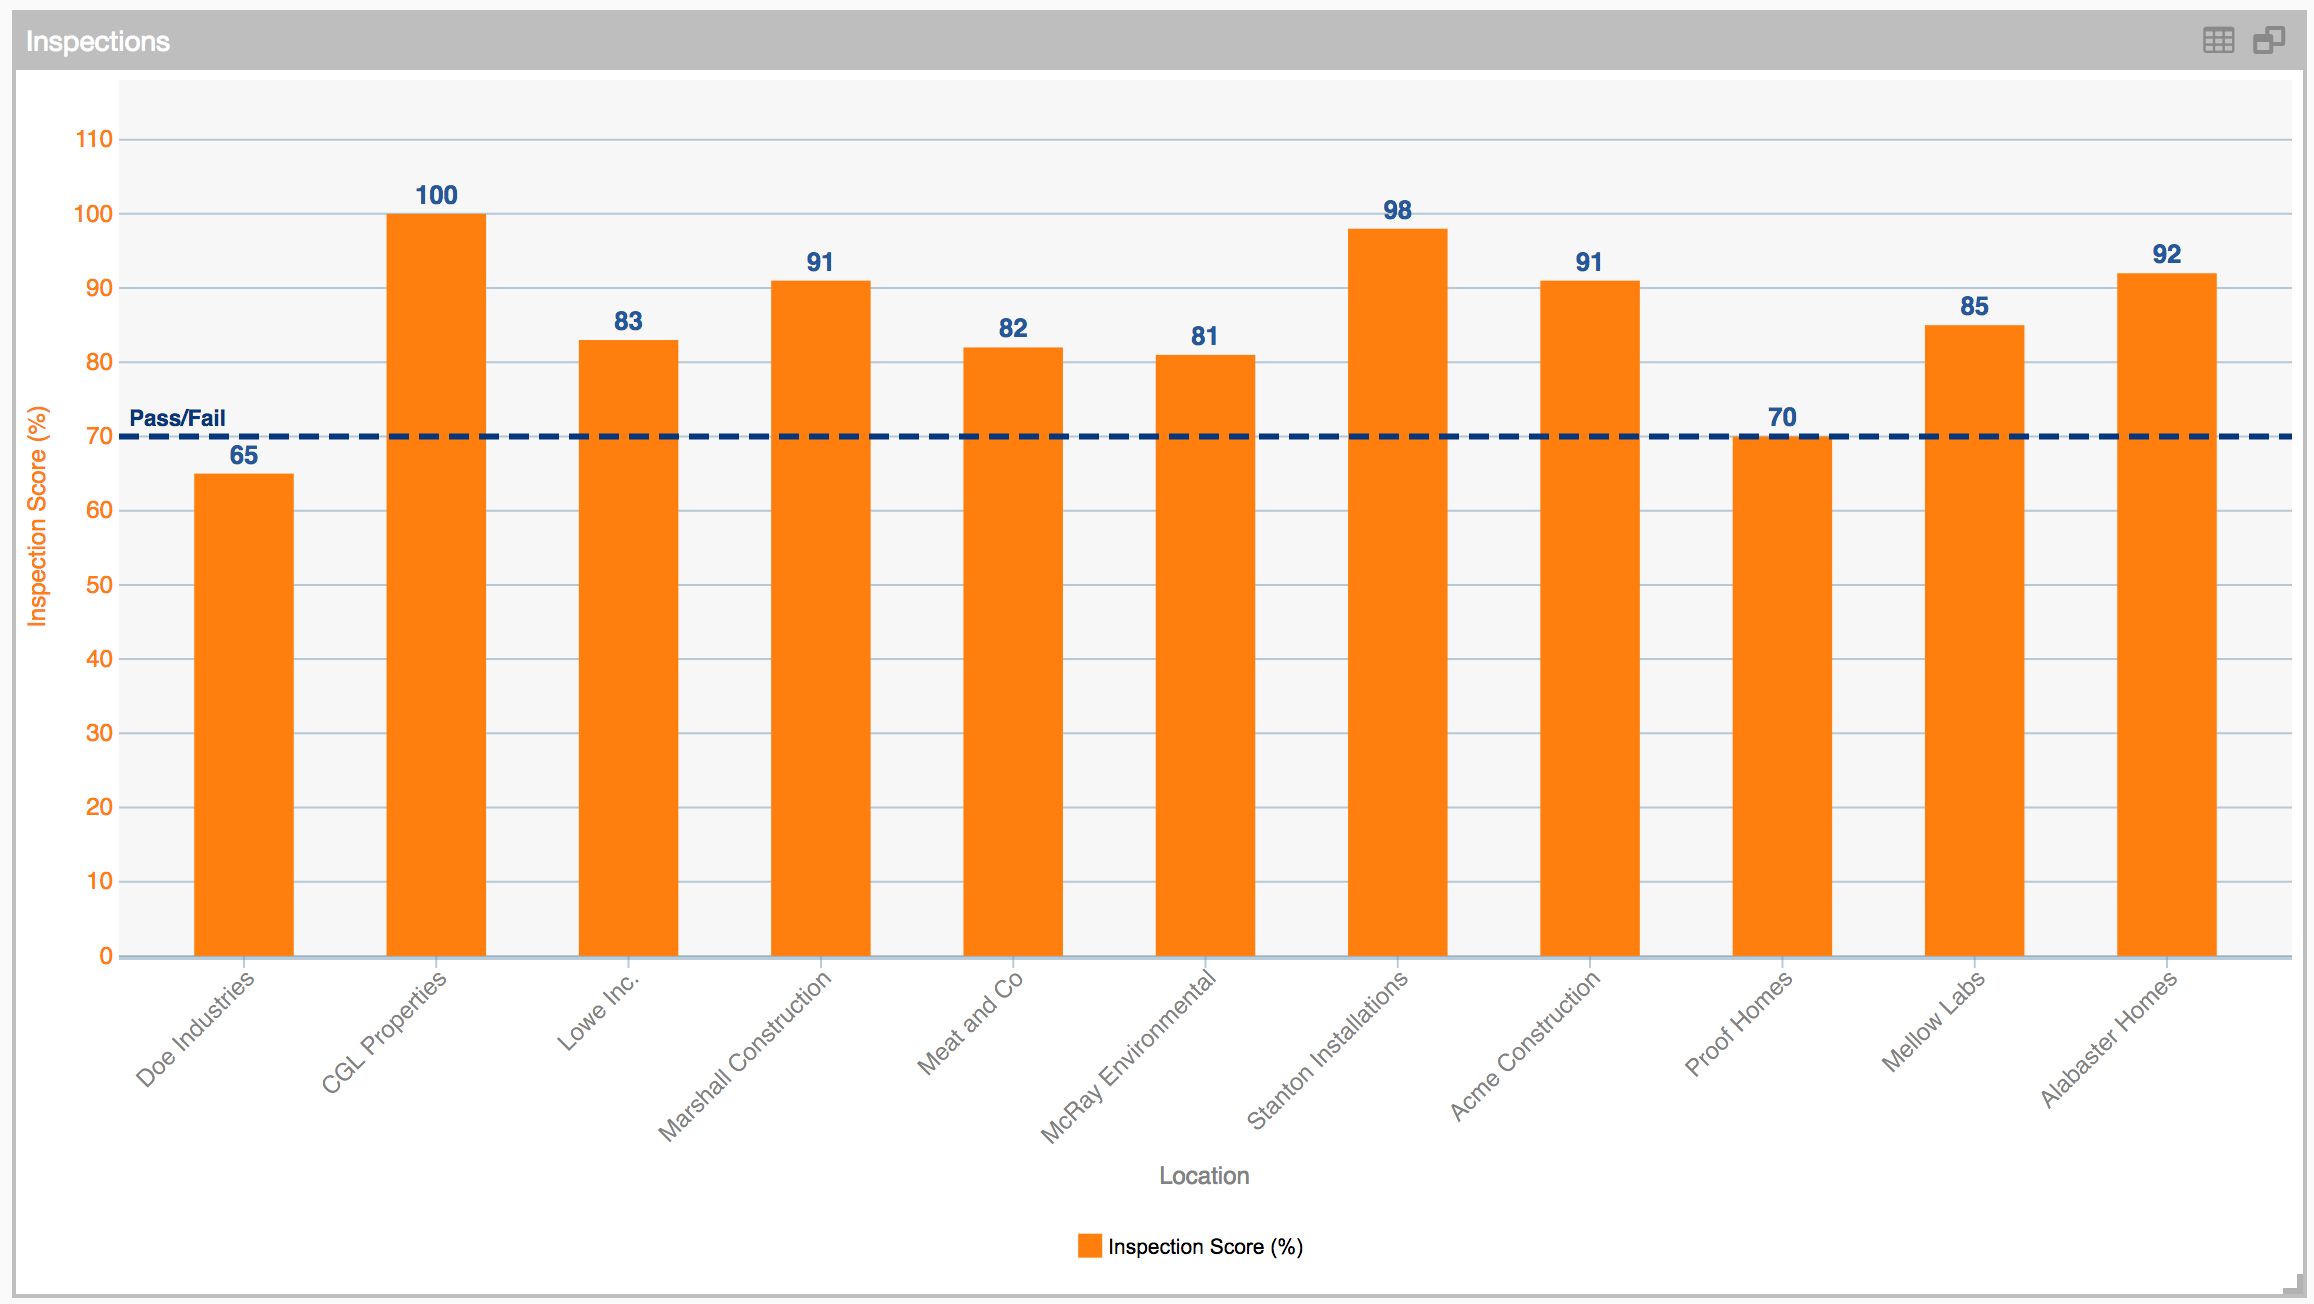
- Enter the label, select or enter the line's value, select colour and style and click "Save"
-
The reference line will be displayed on the chart


Drill down and launch operations
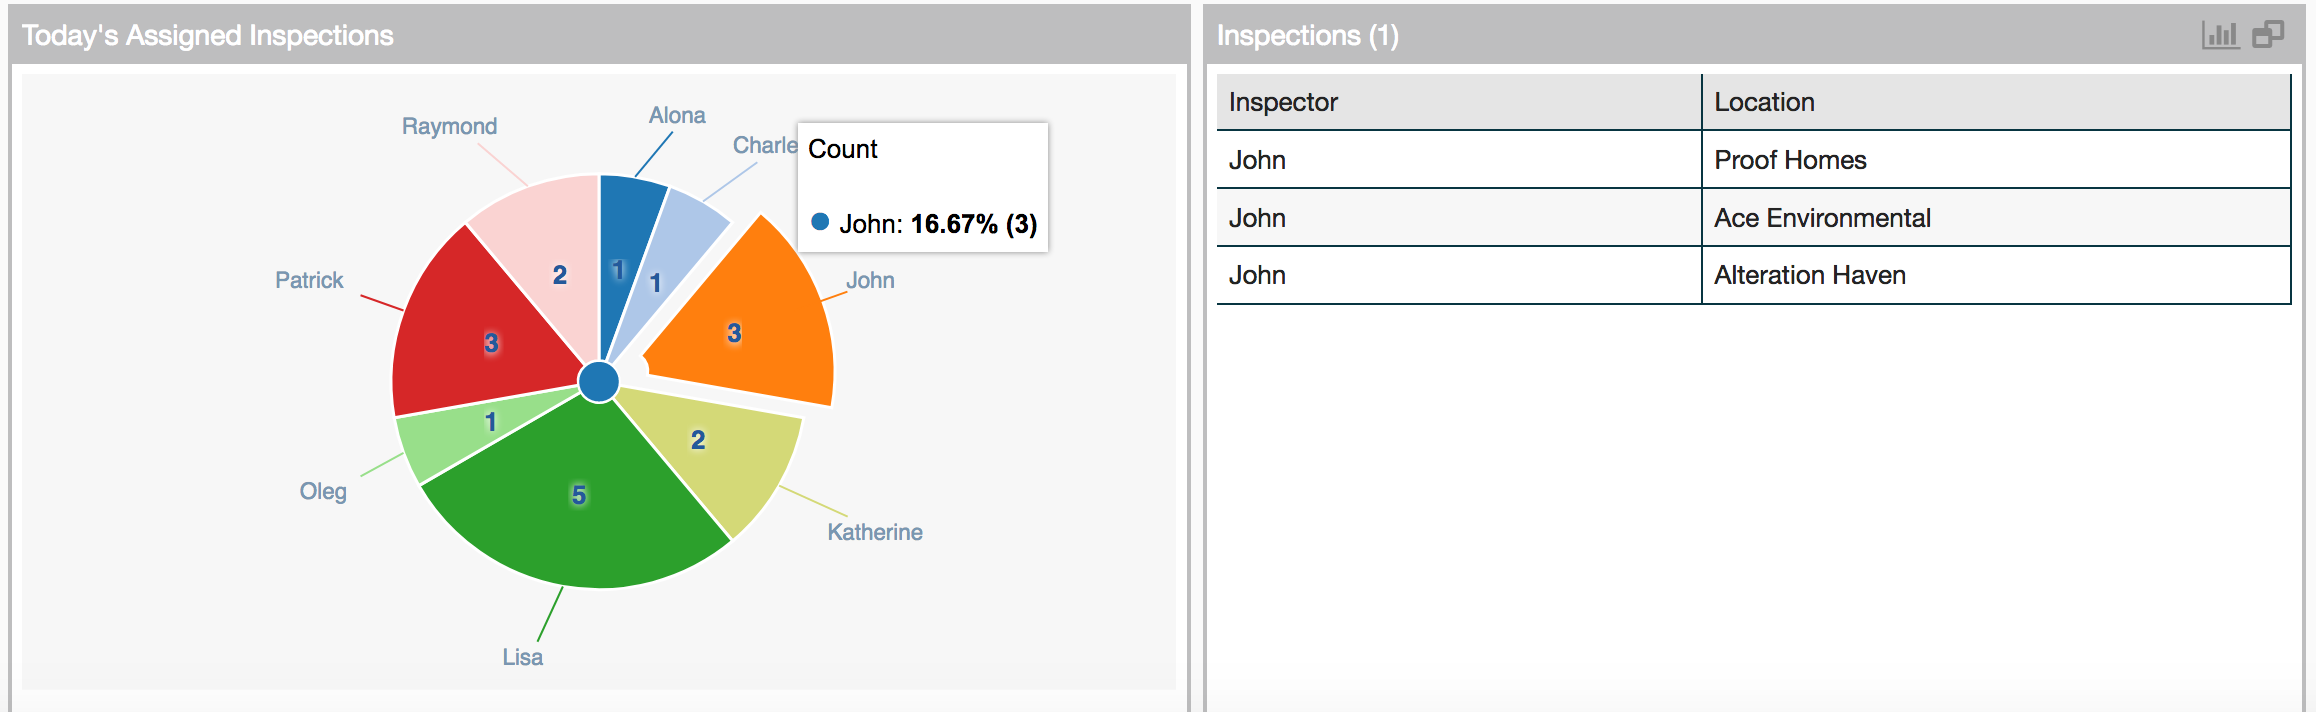
It's also useful to have your data aggregated first, so that you can view a summarized overview of your operations, then drill down to find the record you would like to modify. This can be done with two widgets linked through parameters.
-
Click the "Add Widget" link at the top left to add another widget
-
Select the app and view to be displayed
-
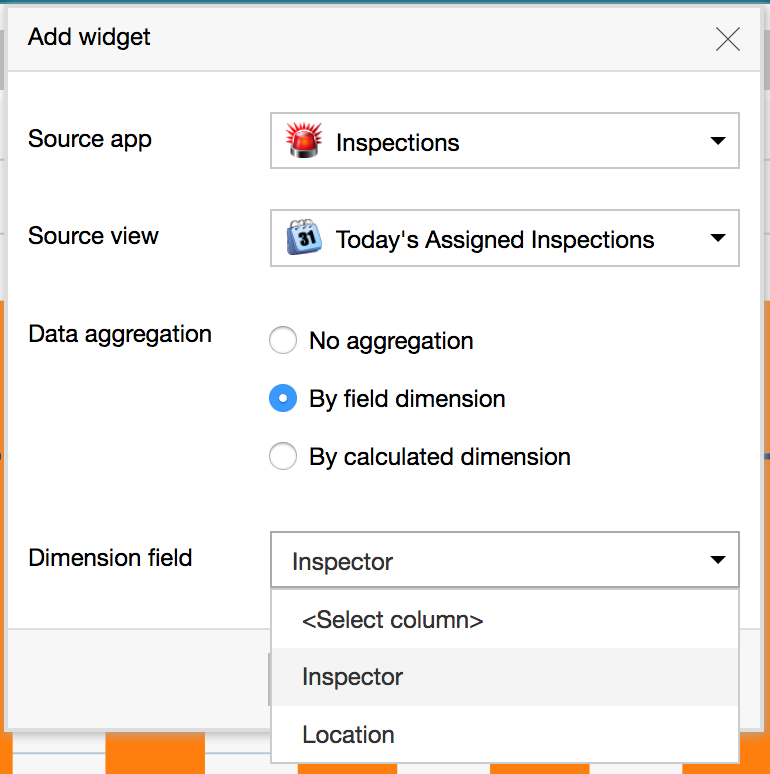
Under "Data aggregation", select "By field dimension" and then "Inspector" to see today's assigned inspections summarized by inspector
-
Right-click on the top gray bar to display the widget's menu, then rename it to "Today's Assigned Inspections"
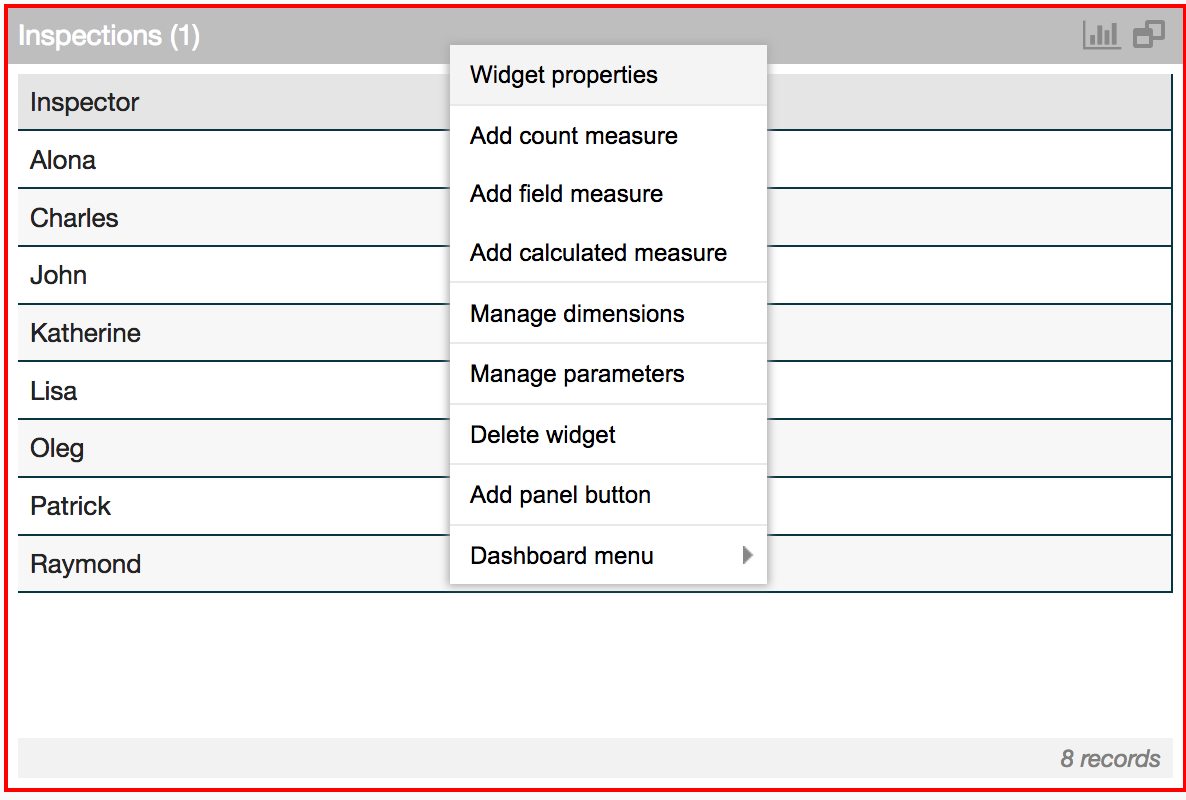
-
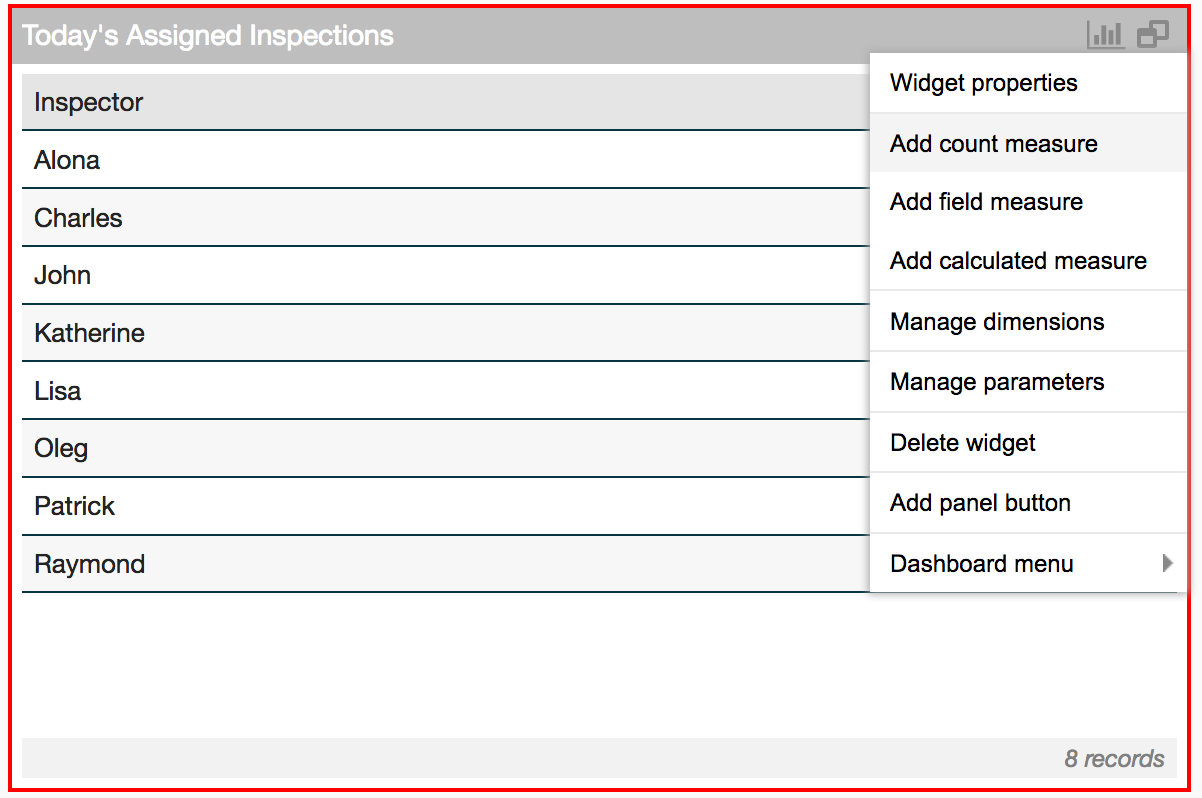
Right-click again on the top gray bar and select "Add count measure" to display how may inspections each inspector has assigned to them today and click "Save"
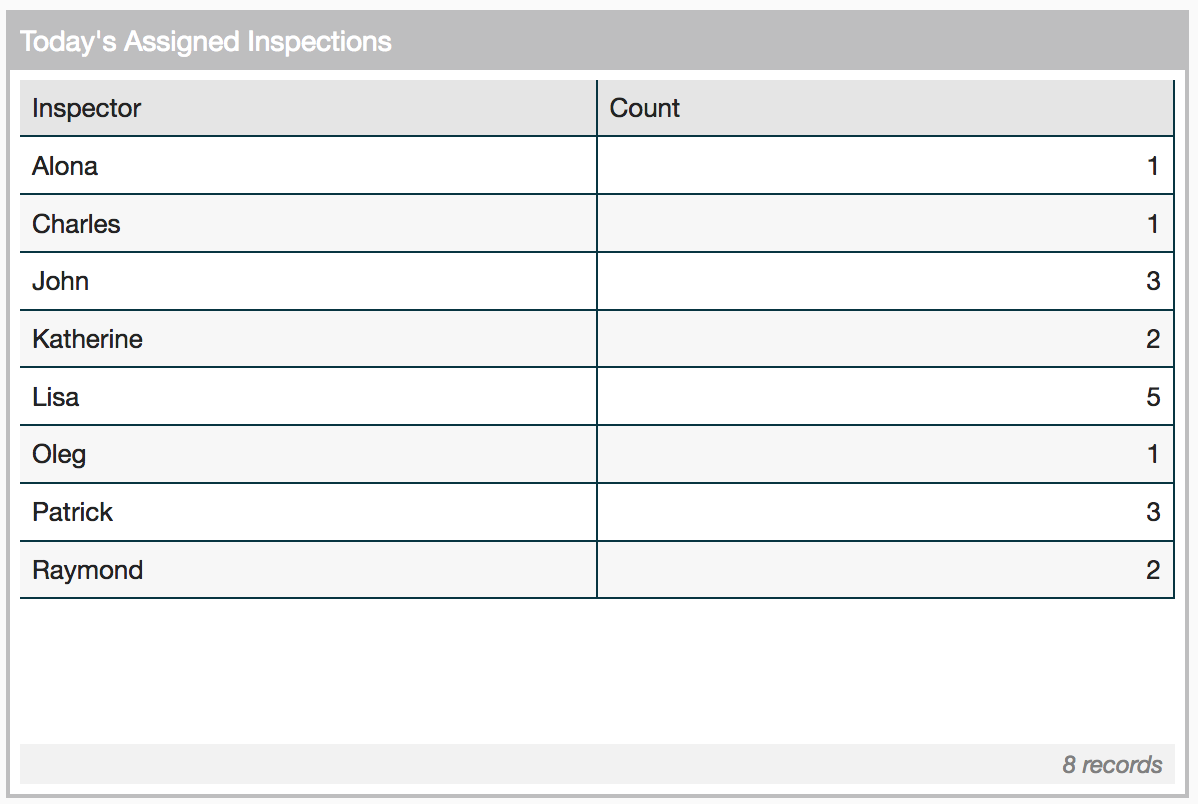
- Click on the chart icon to display the data as a chart
-
To change this to a pie chart, right click on any record in the data series, and select "edit visualization"
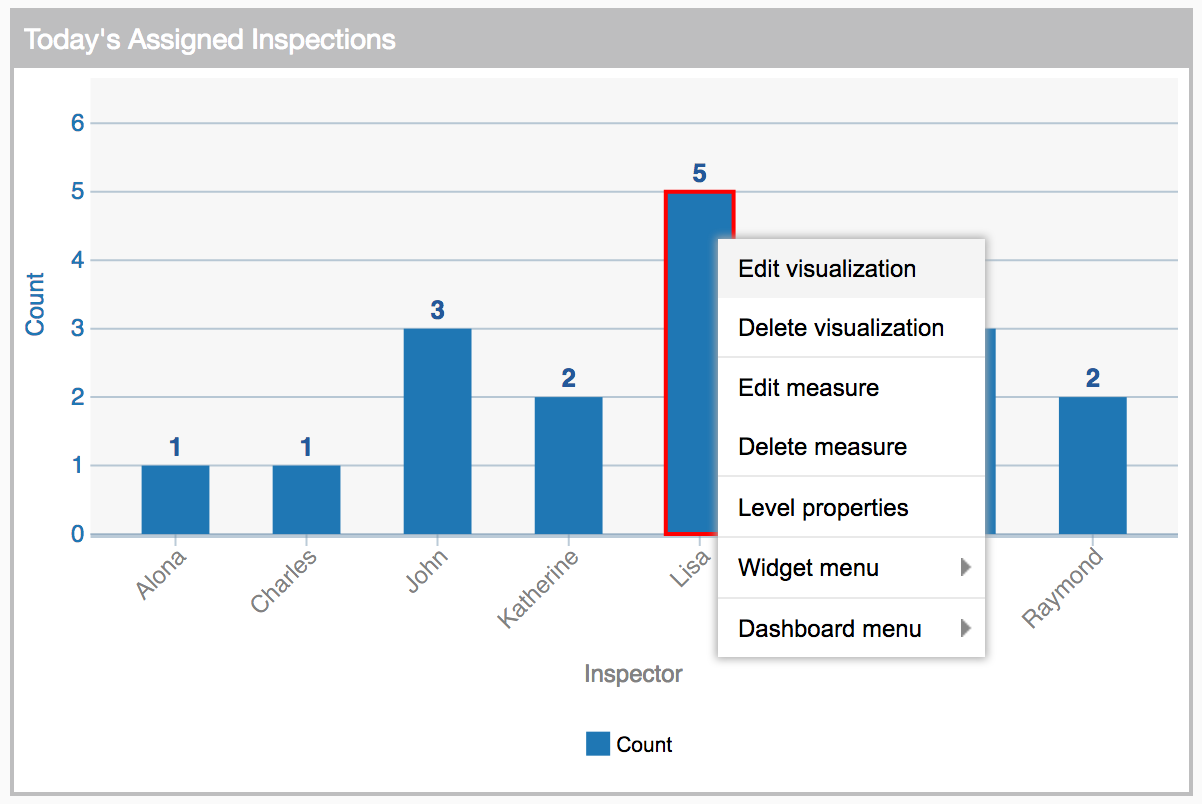
-
Select "pie" and click "Save"
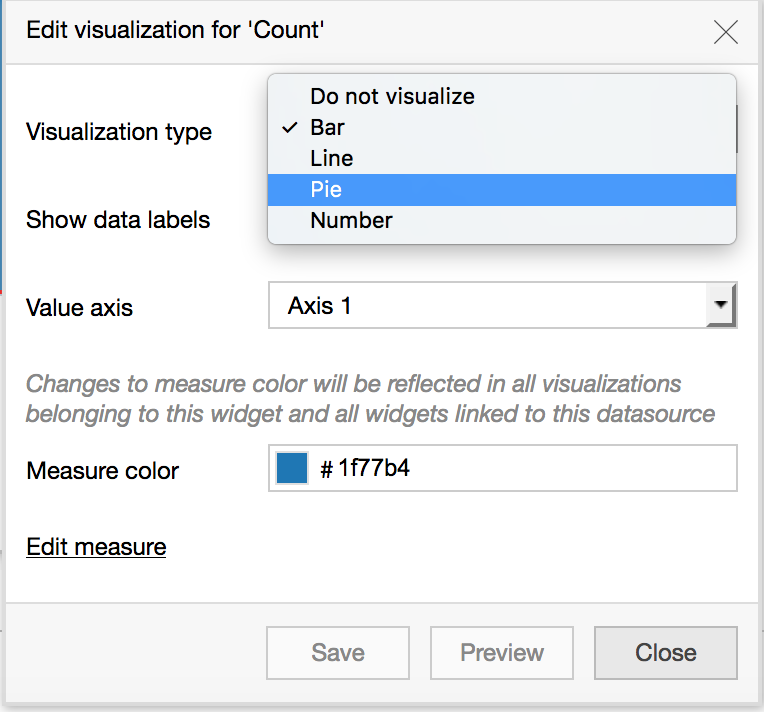
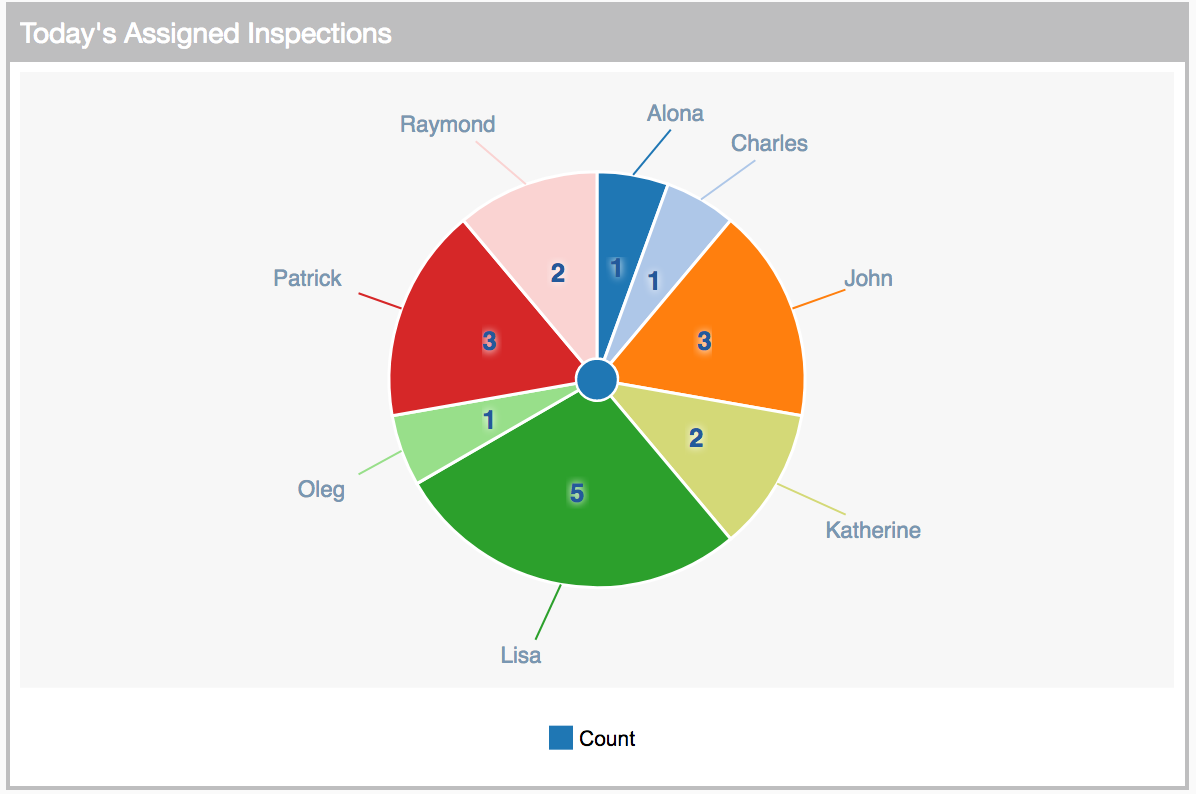
-
Finally, click on the top left link "Add widget" to add another widget
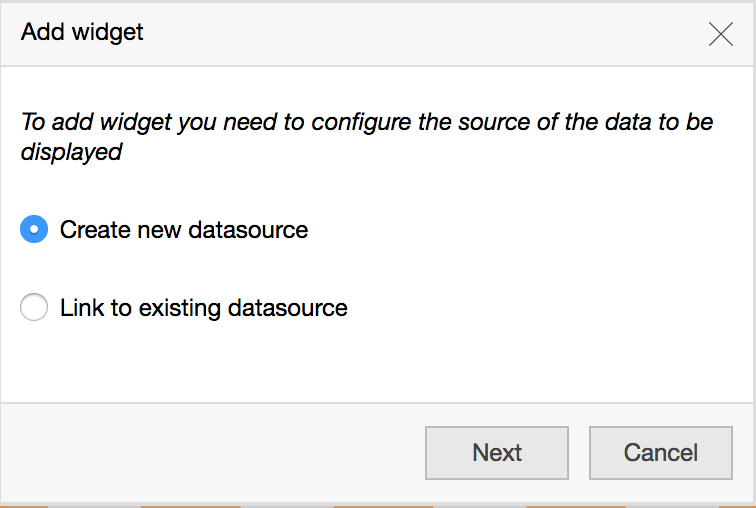
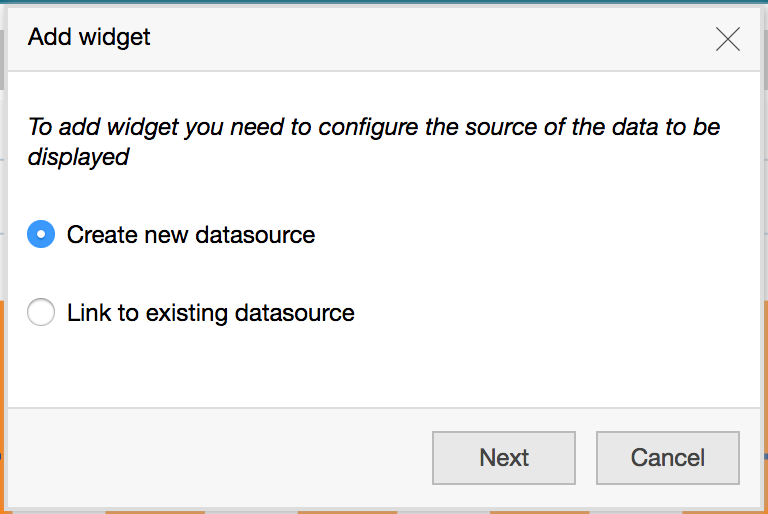
- Select "Create new data source"
-
Select the app and relevant view, "No aggregation" and a category to display
-
Right-click on the top gray bar of the widget, and select "Manage parameters"
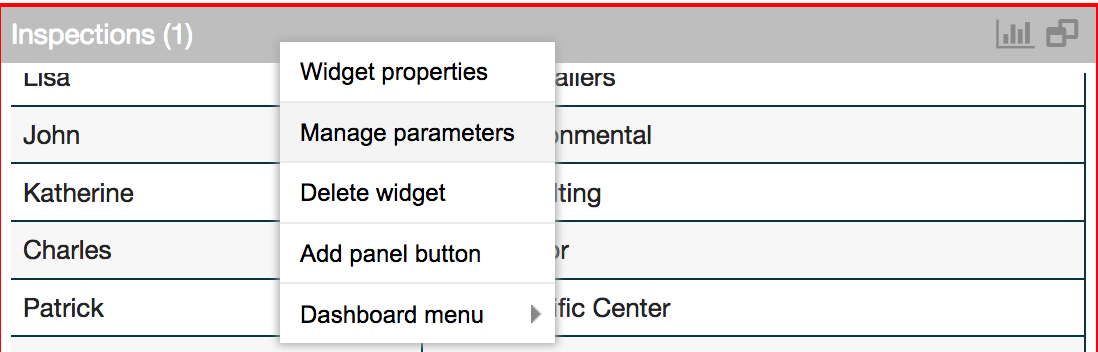
- Any parameters that you added to this View in the app editor will appear here.
-
Under "Mode" choose "Widget Selection" and under "Value", choose the "Today's Assigned Inspections" widget and the field to filter by, which is "Inspector"
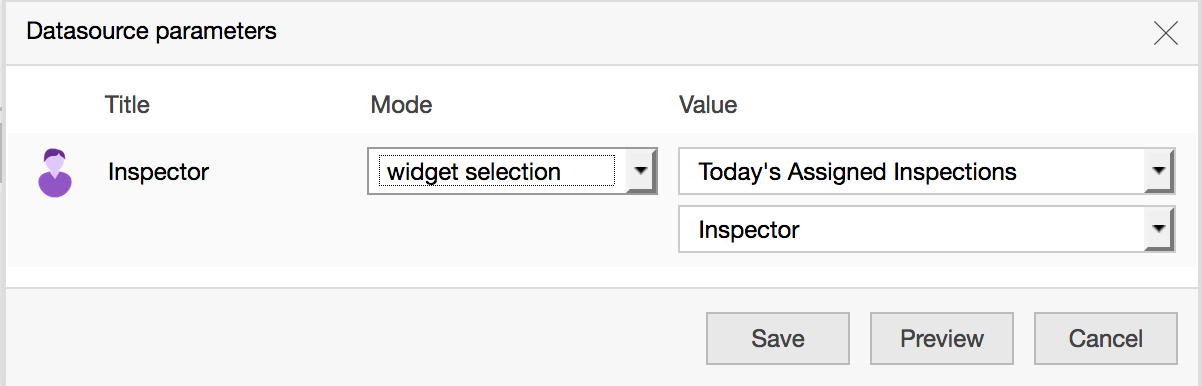
-
Now, the data selected in the widget on the left will filter the widget on the right, and you can launch into record operations from the filtered data.