Make Better Business Decisions with Dashboard Maps
Mar 03, 2020
By Sean King
For years we've heard clients describe their challenges when trying to tie geographic mapping visualizations to structured data. That's why we've added map hosting capabilities to Flowfinity that provide customers an easier way to view records as points on a map hosted within a dashboard widget.
Interactive dashboards in Flowfinity provide a host of benefits, helping businesses measure key metrics visually to make better decisions at every level. Adding dashboard map capabilities empowers our customers to further improve their operational capabilities.
Most organizational data contains a geographical element. These assets, clients, sites, buildings, employees, etc. are all physically located somewhere and what makes maps so useful is that they show the geographic context visually.
Displaying a location as GPS coordinates or even as an address makes it difficult for a person to identify and analyze patterns, distances and clusters. Displaying the coordinates as pins on a map makes it easy.
Maps are an especially powerful tool for field service, construction, sales, engineering, and environmental services firms that collect large amounts of field data, and need the exact location of data collection for operational efficiency and analysis.
To understand more about how Flowfinity dashboard maps can help your organization, here is a brief overview of how to leverage the mapping capabilities enabled in our latest release:
Mapping features
Display and interact with location data in dashboard maps
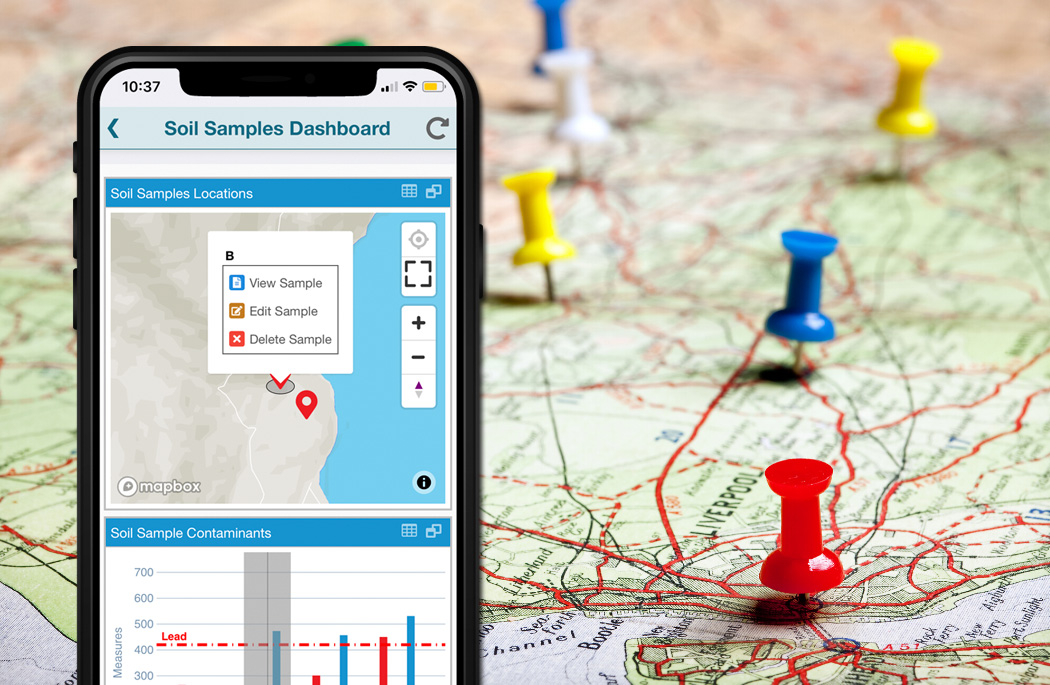
In Flowfinity 19.3 you will now be able to display data in dashboard maps.
To display records as locations on a map you need to include a location field in your form. The next steps are to complete the map configuration and create a map widget. When complete, data records from the selected application will be rendered onto your dashboard map as customizable pins.
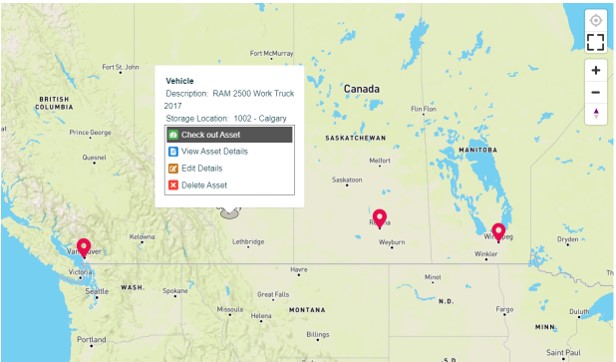
From this map widget, admins can also configure additional functionality, such as launching record operations, performing drill-downs, and configuring color-coded markers to identify record types at a glance.
These dashboard customizations are based on the configuration of the underlying app and its records, allowing administrators to also display any relevant data fields in a pop-up menu. Use this this to avoid asset management errors by configuring different color markers, such as orange or red, to easily communicate the status of an asset due for scheduled maintenance.
Rendering data onto customized dashboard maps is particularly useful for professionals in engineering, construction, field service, and environmental industries, who frequently deal with data that must be analyzed in a spatial context.
Tying Flowfinity data to a geospatial map, allows professionals to round out their IT ecosystem by hosting a geographic information system (GIS) map in their core data management system.
Follow your device on a map
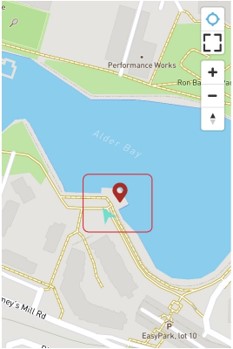
This feature allows end-users to navigate to a location using a mobile device to follow a map.
This is particularly useful in locations where street addresses are not available, such as construction sites or remote wilderness areas. The screenshot below is an example this functionality being leveraged to navigate to a location.
For example, an environmental scientist who must locate the site of a sample in the field. This capability allows the user to travel to the correct coordinates by using the map for reference.
Please note, this is helpful as tool to visualize the location of the both the end-user and the asset or GPS coordinates. Flowfinity dashboard maps do not provide routing.
Select and pinpoint a location remotely
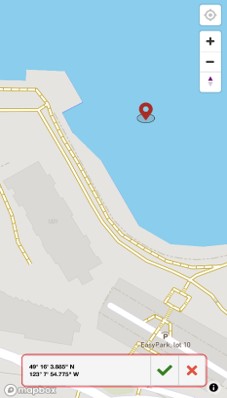
The Flowfinity Actions 19.3 release also allows end-users to select coordinates on a map, drawing this value into a location field of an application.
This is useful functionality when a location is inaccessible or unsafe to visit. An end-user can open a map then select the desired location, with those coordinates populating the Location field in the app.
There is no requirement for the end-user to travel to or near those coordinates to capture this data. For example, during an inspection, an inspector may notice something worth recording at the bottom of a rock face. Using this functionality, the inspector can record accurate coordinates from a safe distance.
These new Flowfinity features will improve the end-user experience for field data collection and management, offering customers additional workflow options and increasing efficiency. Currently, Flowfinity supports three map sources for dashboard widgets.
For an organization that currently leverages Esri basemaps, custom map styles can be uploaded into Flowfinity and configured for use in dashboards. Mapbox and MapTiler are alternative map sources that can be also be enabled for Flowfinity use, both offer a tiered pricing models that Flowfinity clients are free to explore.
For more information about how to host maps in Flowfinity dashboards, visit our Knowledge Base or contact us.