Mapping Streams Data
You can connect your Flowfinity Streams data to maps hosted in dashboards to display dynamic color coding of map icons to show various parameters or track the status of a stream, for example online or offline. This is a useful way to check the operational status of facilities and environmental sensors remotely at a glance within your geographic areas.
First, we will create apps with views to manage and collect the Streams reference data, with an automated Task to show the sensor status, then we will configure our dashboard map to display.
- Our first app is to manage the Stream so it's easy to identify once online. Create a New Application, name it (we call ours - 'Sensors') and fill out the 'Properties' section. Then navigate to the 'Form' tab to add 'sensor' meta data fields such as its title/description, unique ID GPS location and any other data that is unique to the sensor.
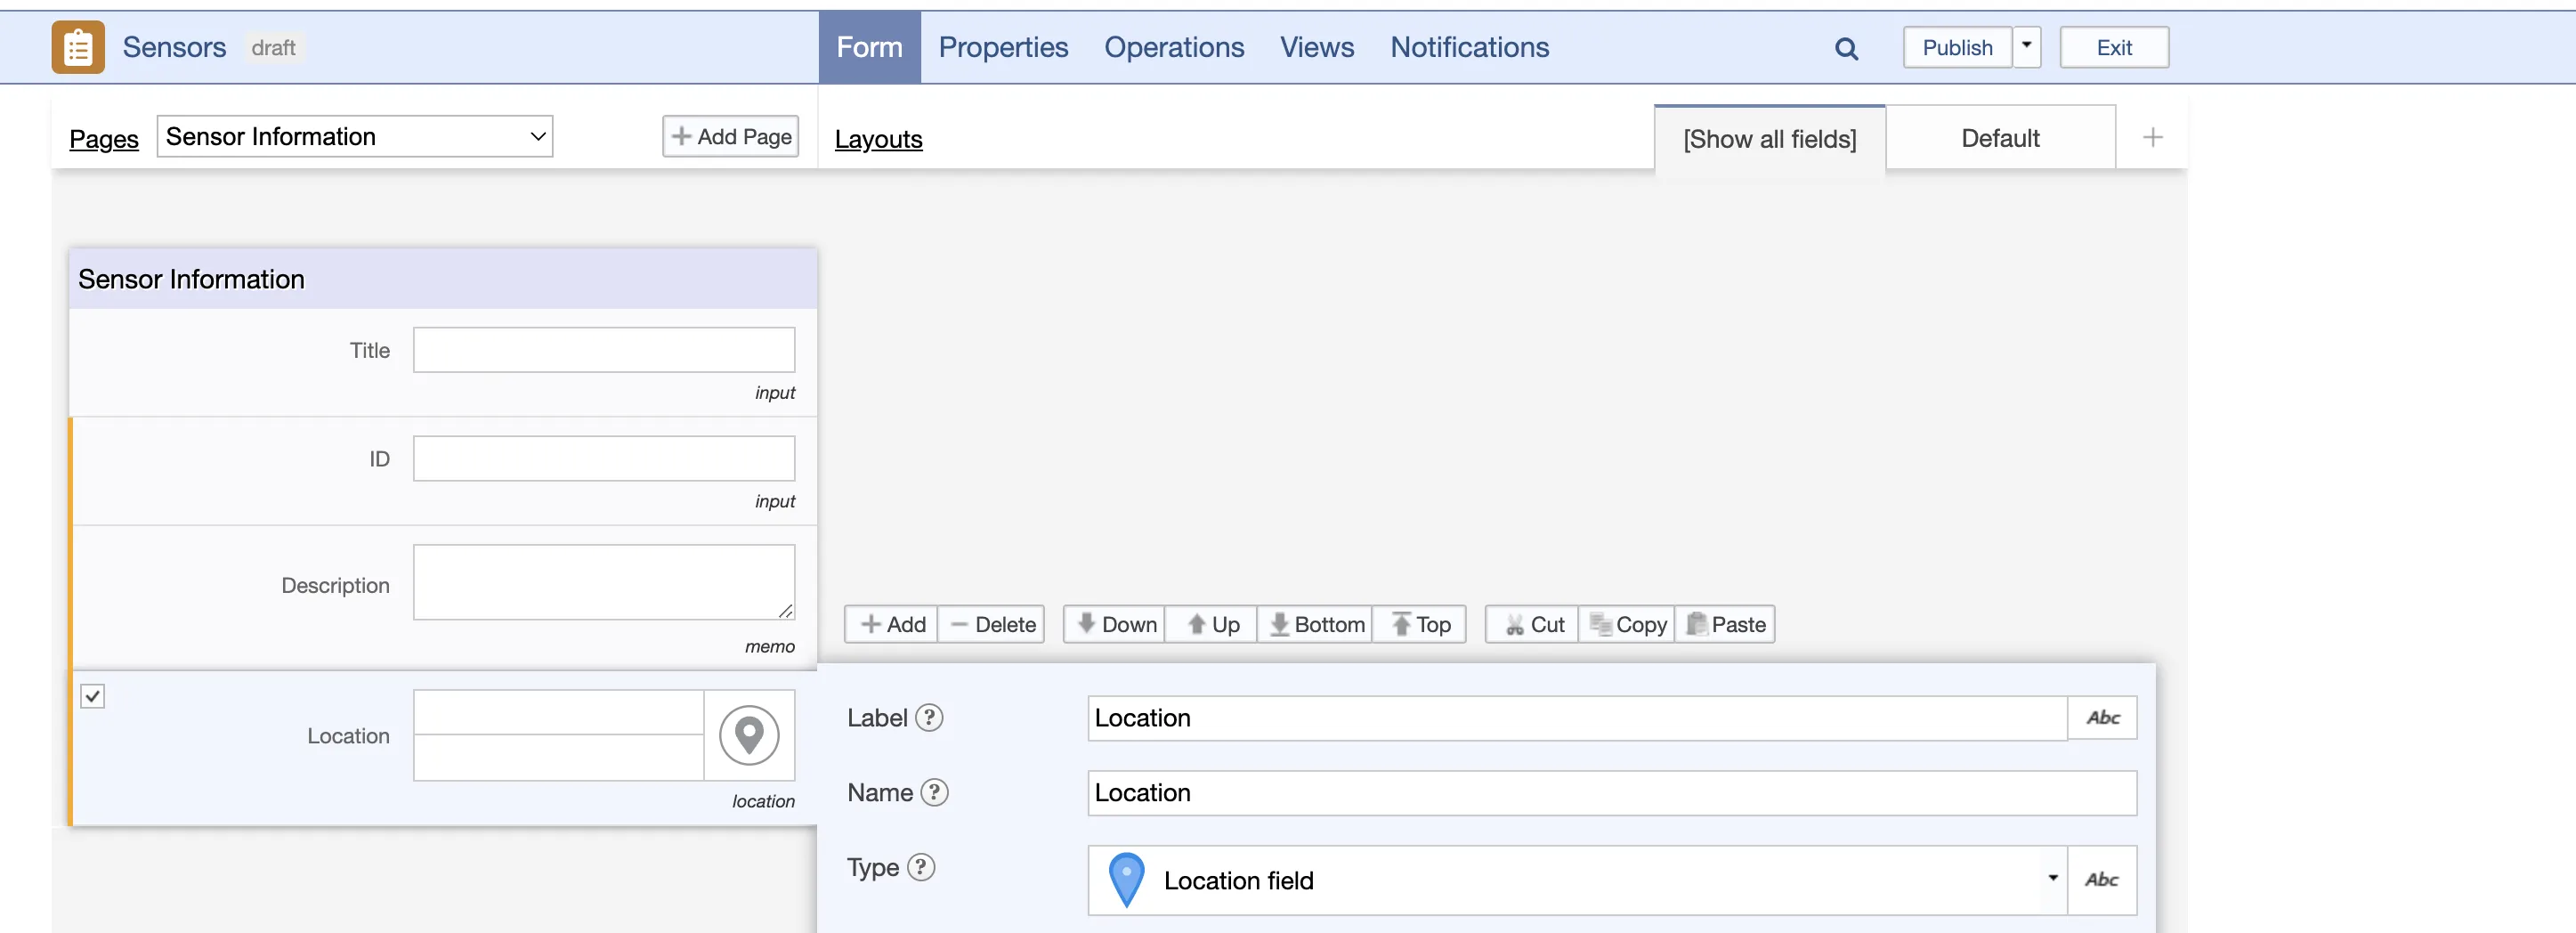
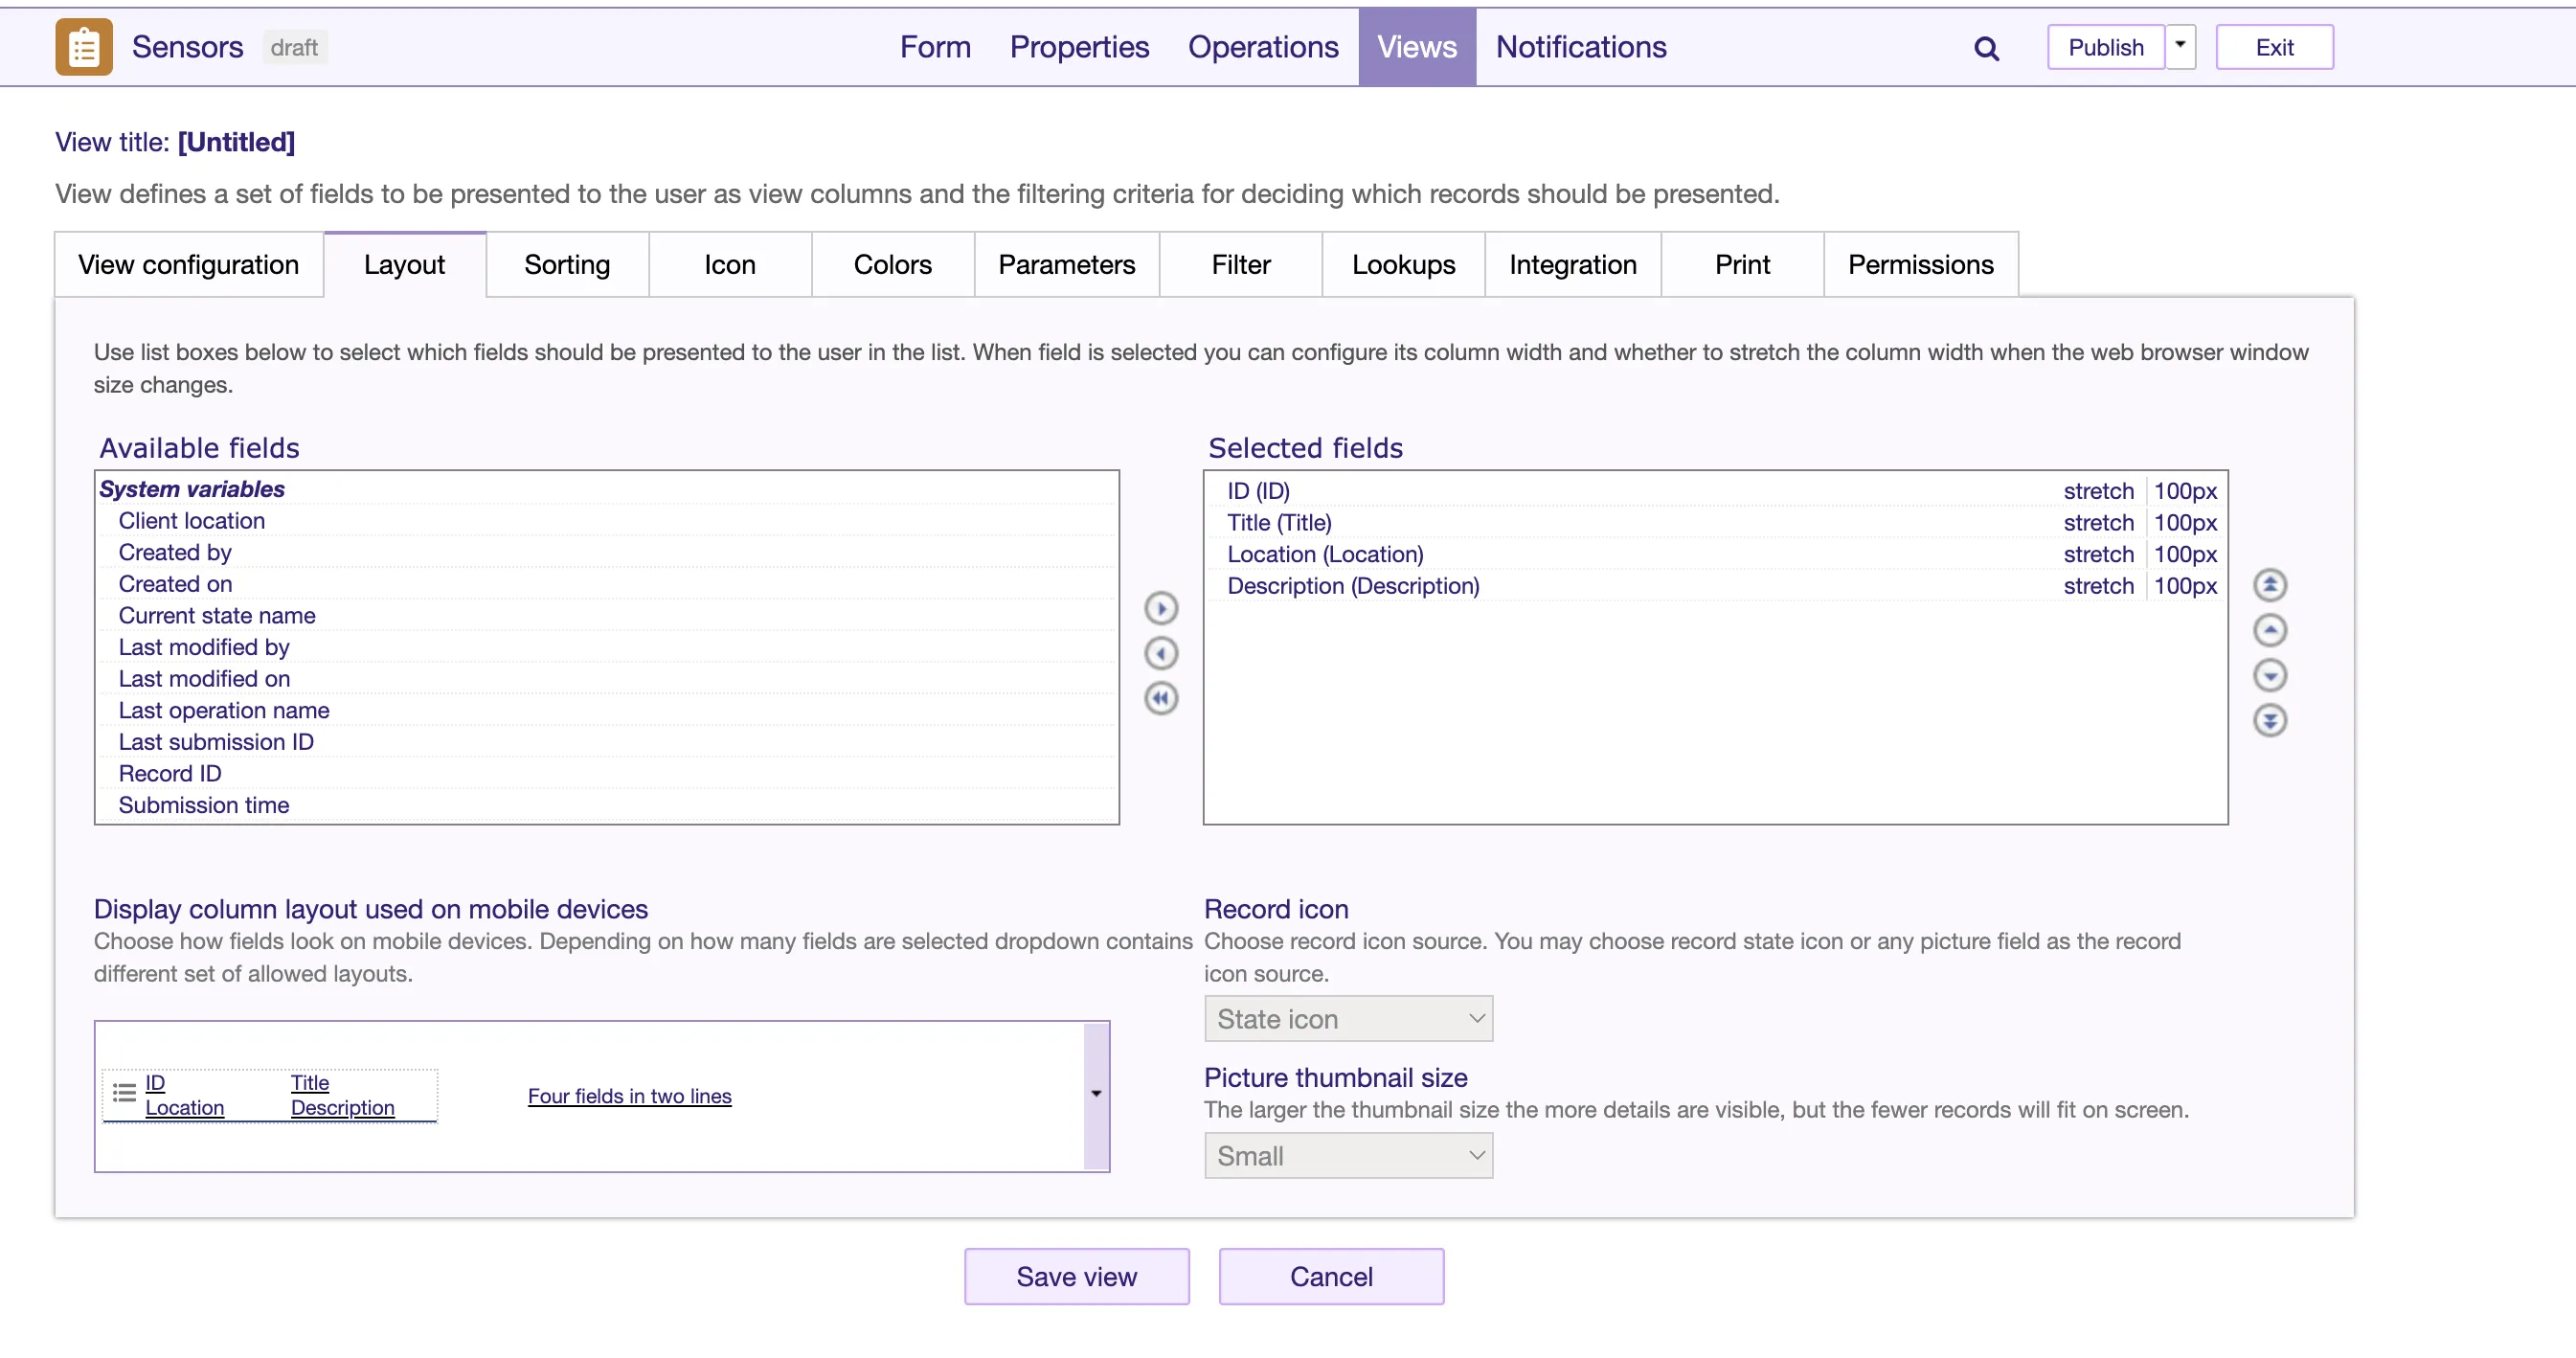
- Go to the 'View' tab and create a new view that will be enabled for lookup and assign the display columns in the 'Layout' section.
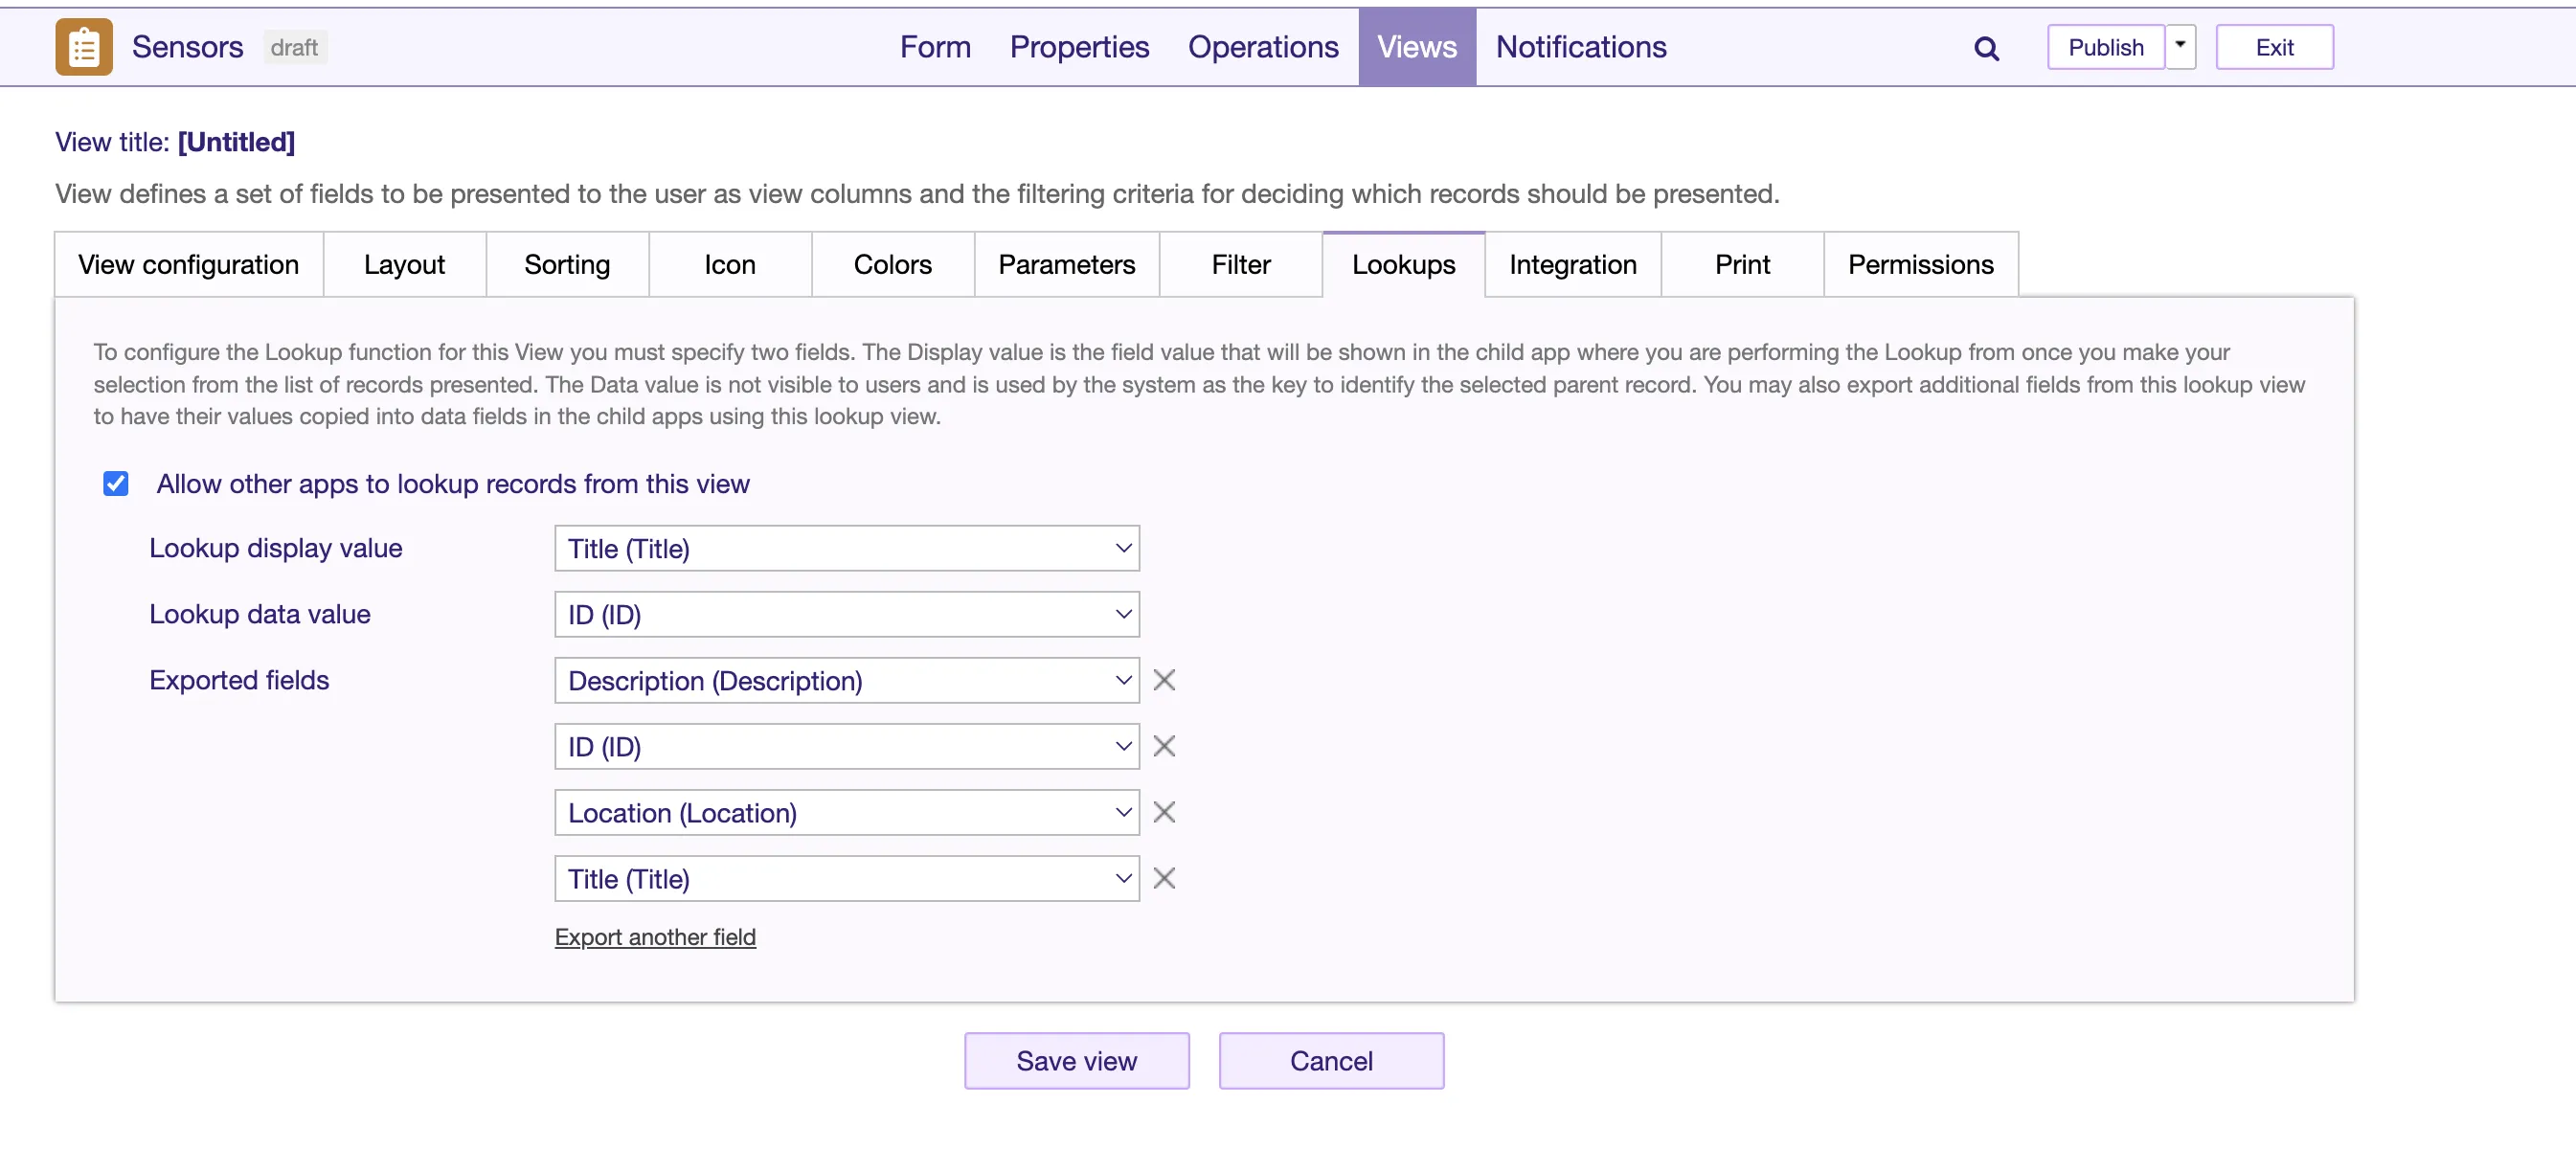
- Switch to the 'Lookups' section, enable the checkbox 'Allow other apps to lookup records from this view' so the view can be used as a lookup and assign your desired export fields.
- Save your changes and publish the 'Sensors' application.
- Our second app will collect the streams data and determine if the Stream is offline by using a Task robot.
Create new app, provide a relevant neame (Sensor Data), and set the 'App Type' to 'Sensor data stream (Streams)'. This will optimize the app for machine data input.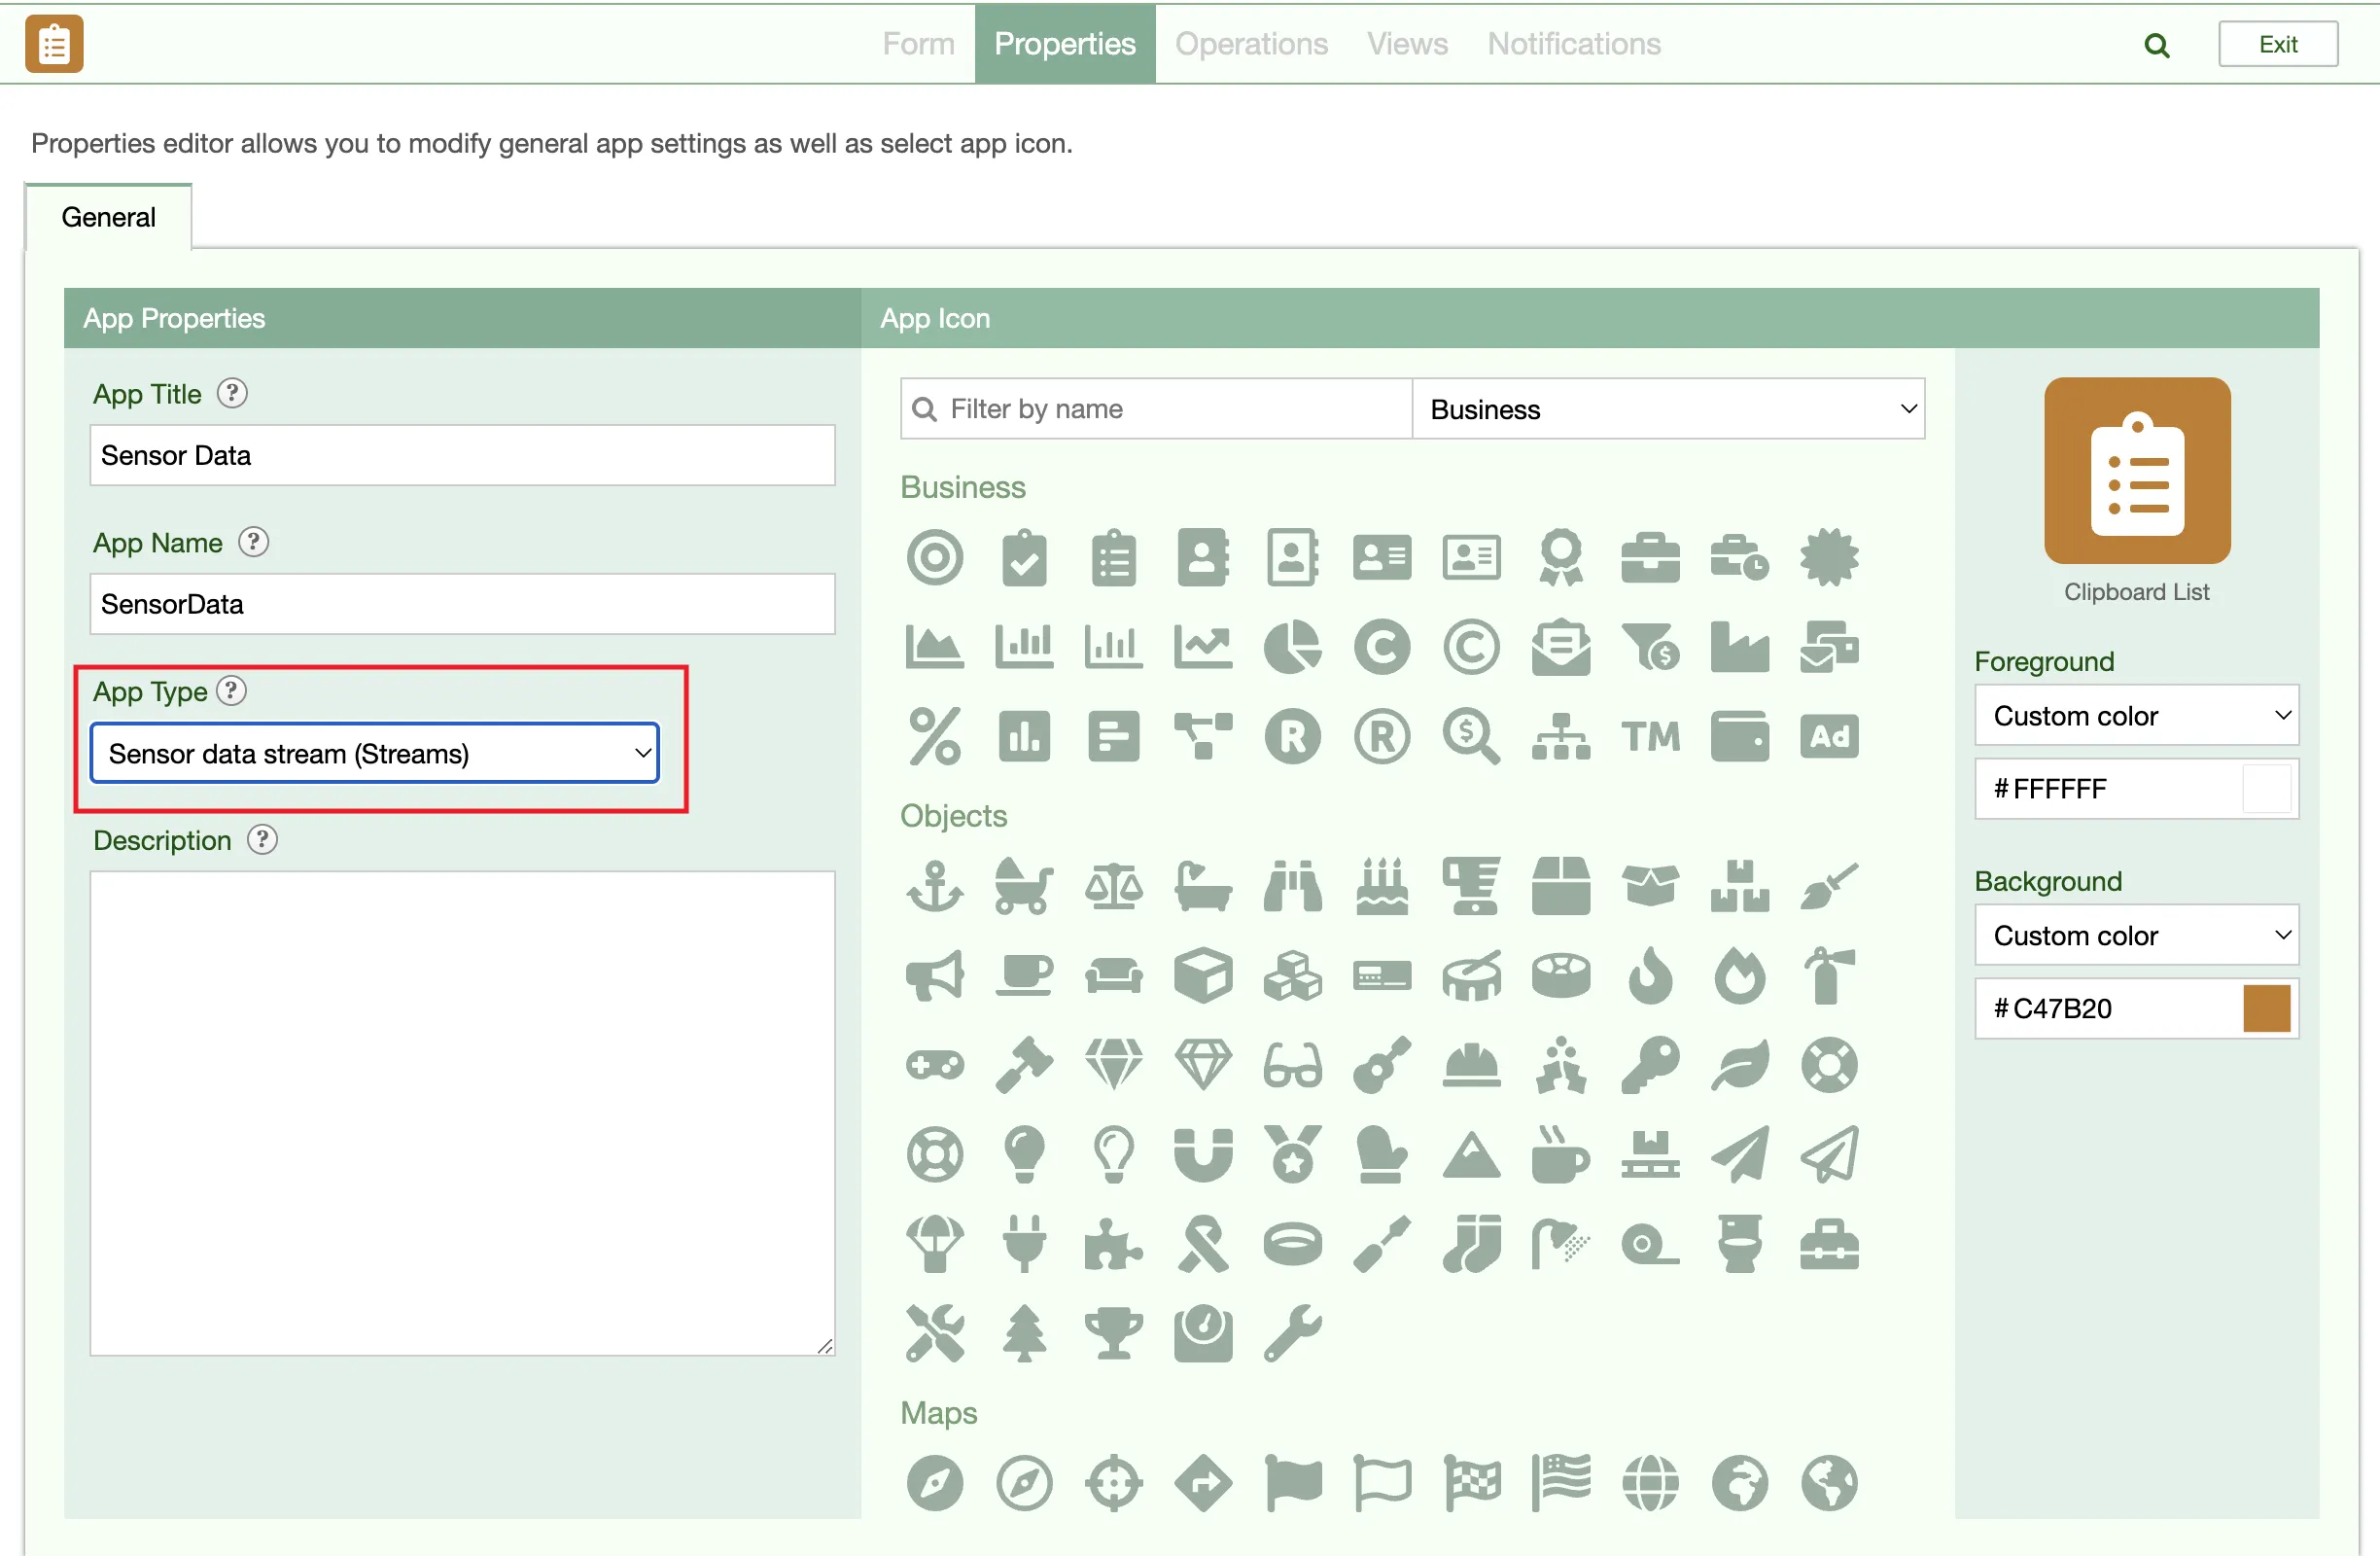
*Note: We will use records in the 'Sensors' app we just created as the definition for data streams from the 'Sensor Data' app. - Click 'Next' to create the app and then navigate to the 'Properties' tab again. Click on the 'Streams App Settings' section.
Here you can control whether the system is using built in stream tracking or an external app to manage the stream (as we just created).
Click on the 'Using app-based management' option of the 'Stream management for this app' radio button, then configure what app/view you want to use for managing streams, then save the changes.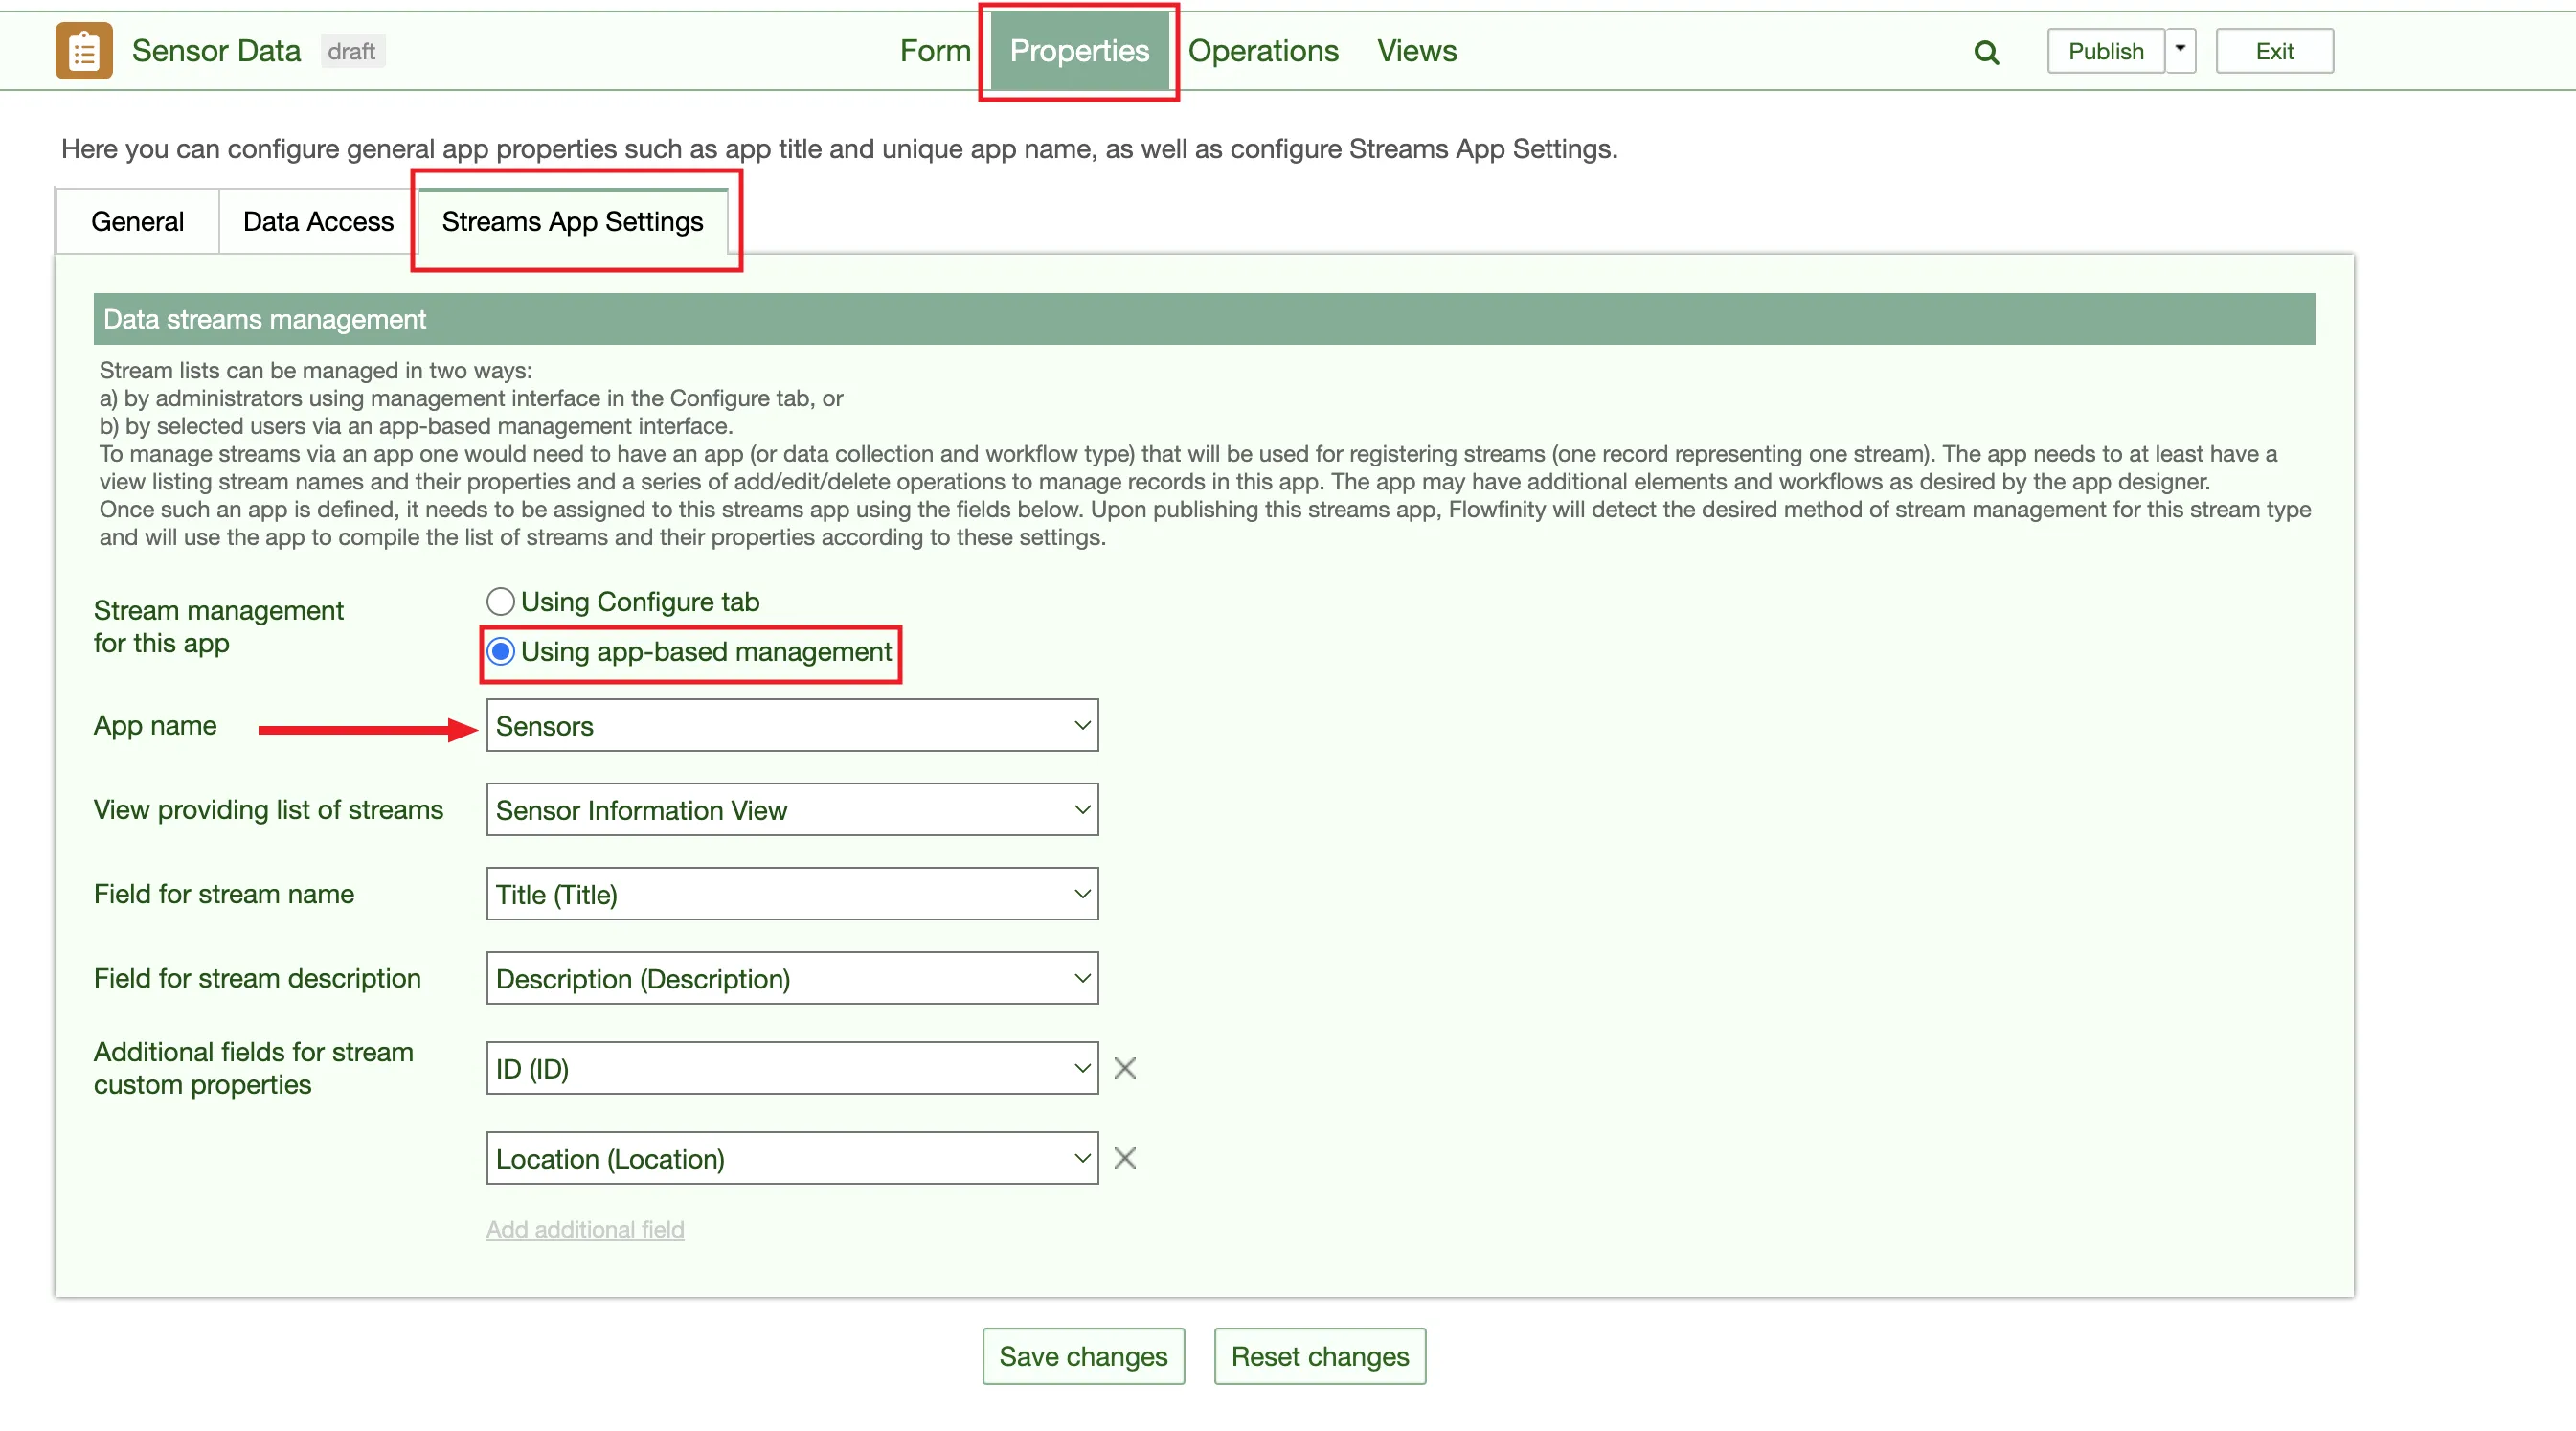
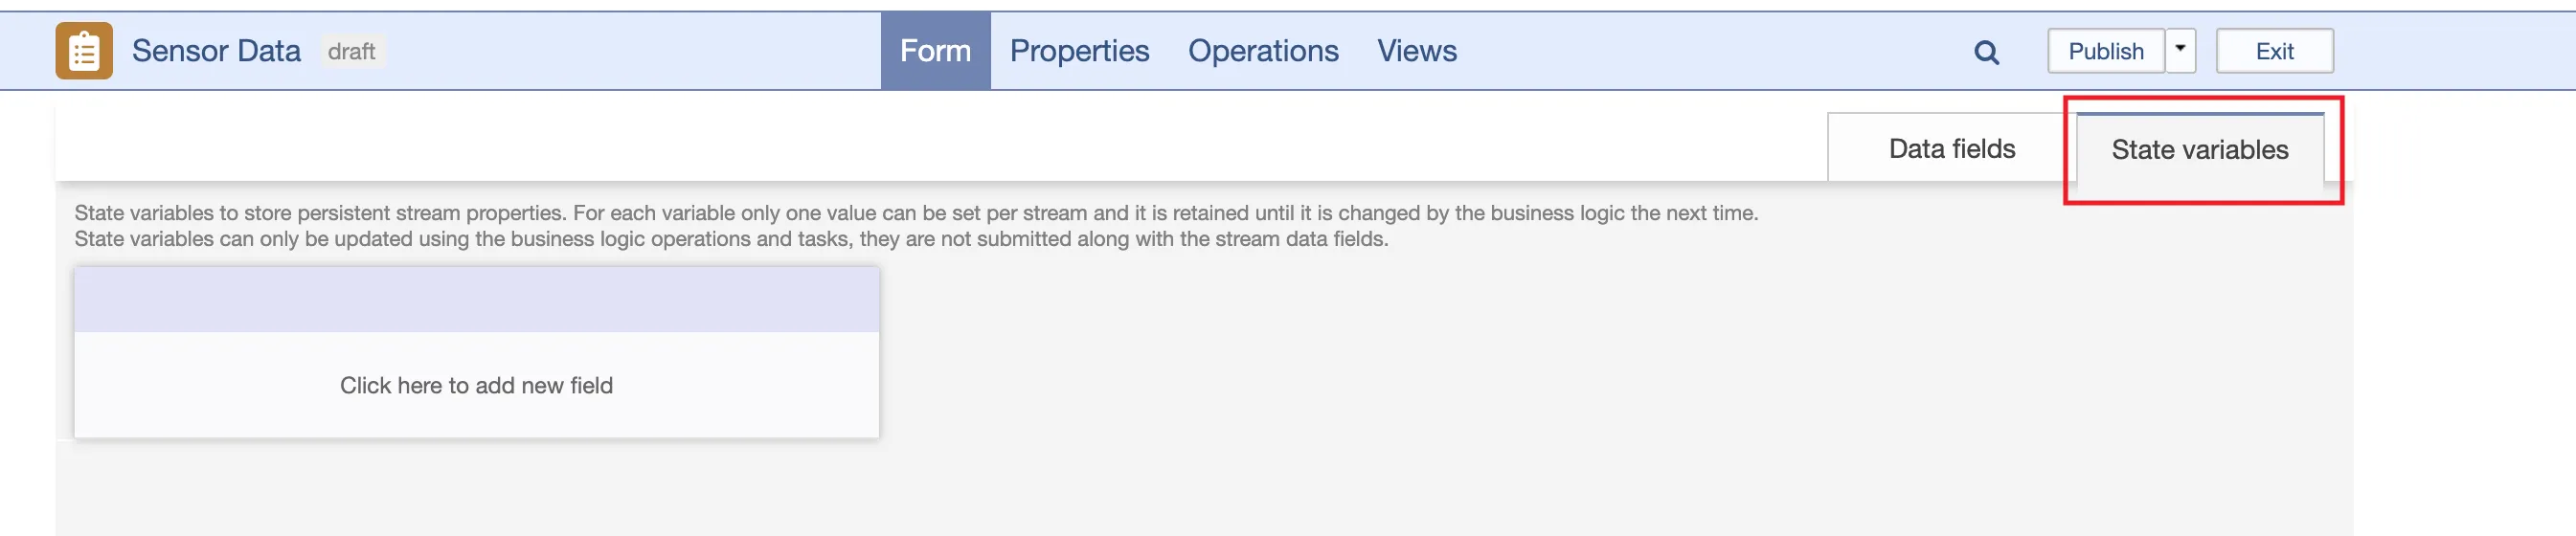
- Return to the 'Form' section and then navigagte to the 'State Variables' section to add the fields necessary for tracking the status of the stream.
- We will be tracking one variable to determine if the stream is online of offline so that we can display this status on the map. 'Click here to add a new field' and label it 'Status'. Type is 'Numeric field'. Provide a description as needed.
Save the form.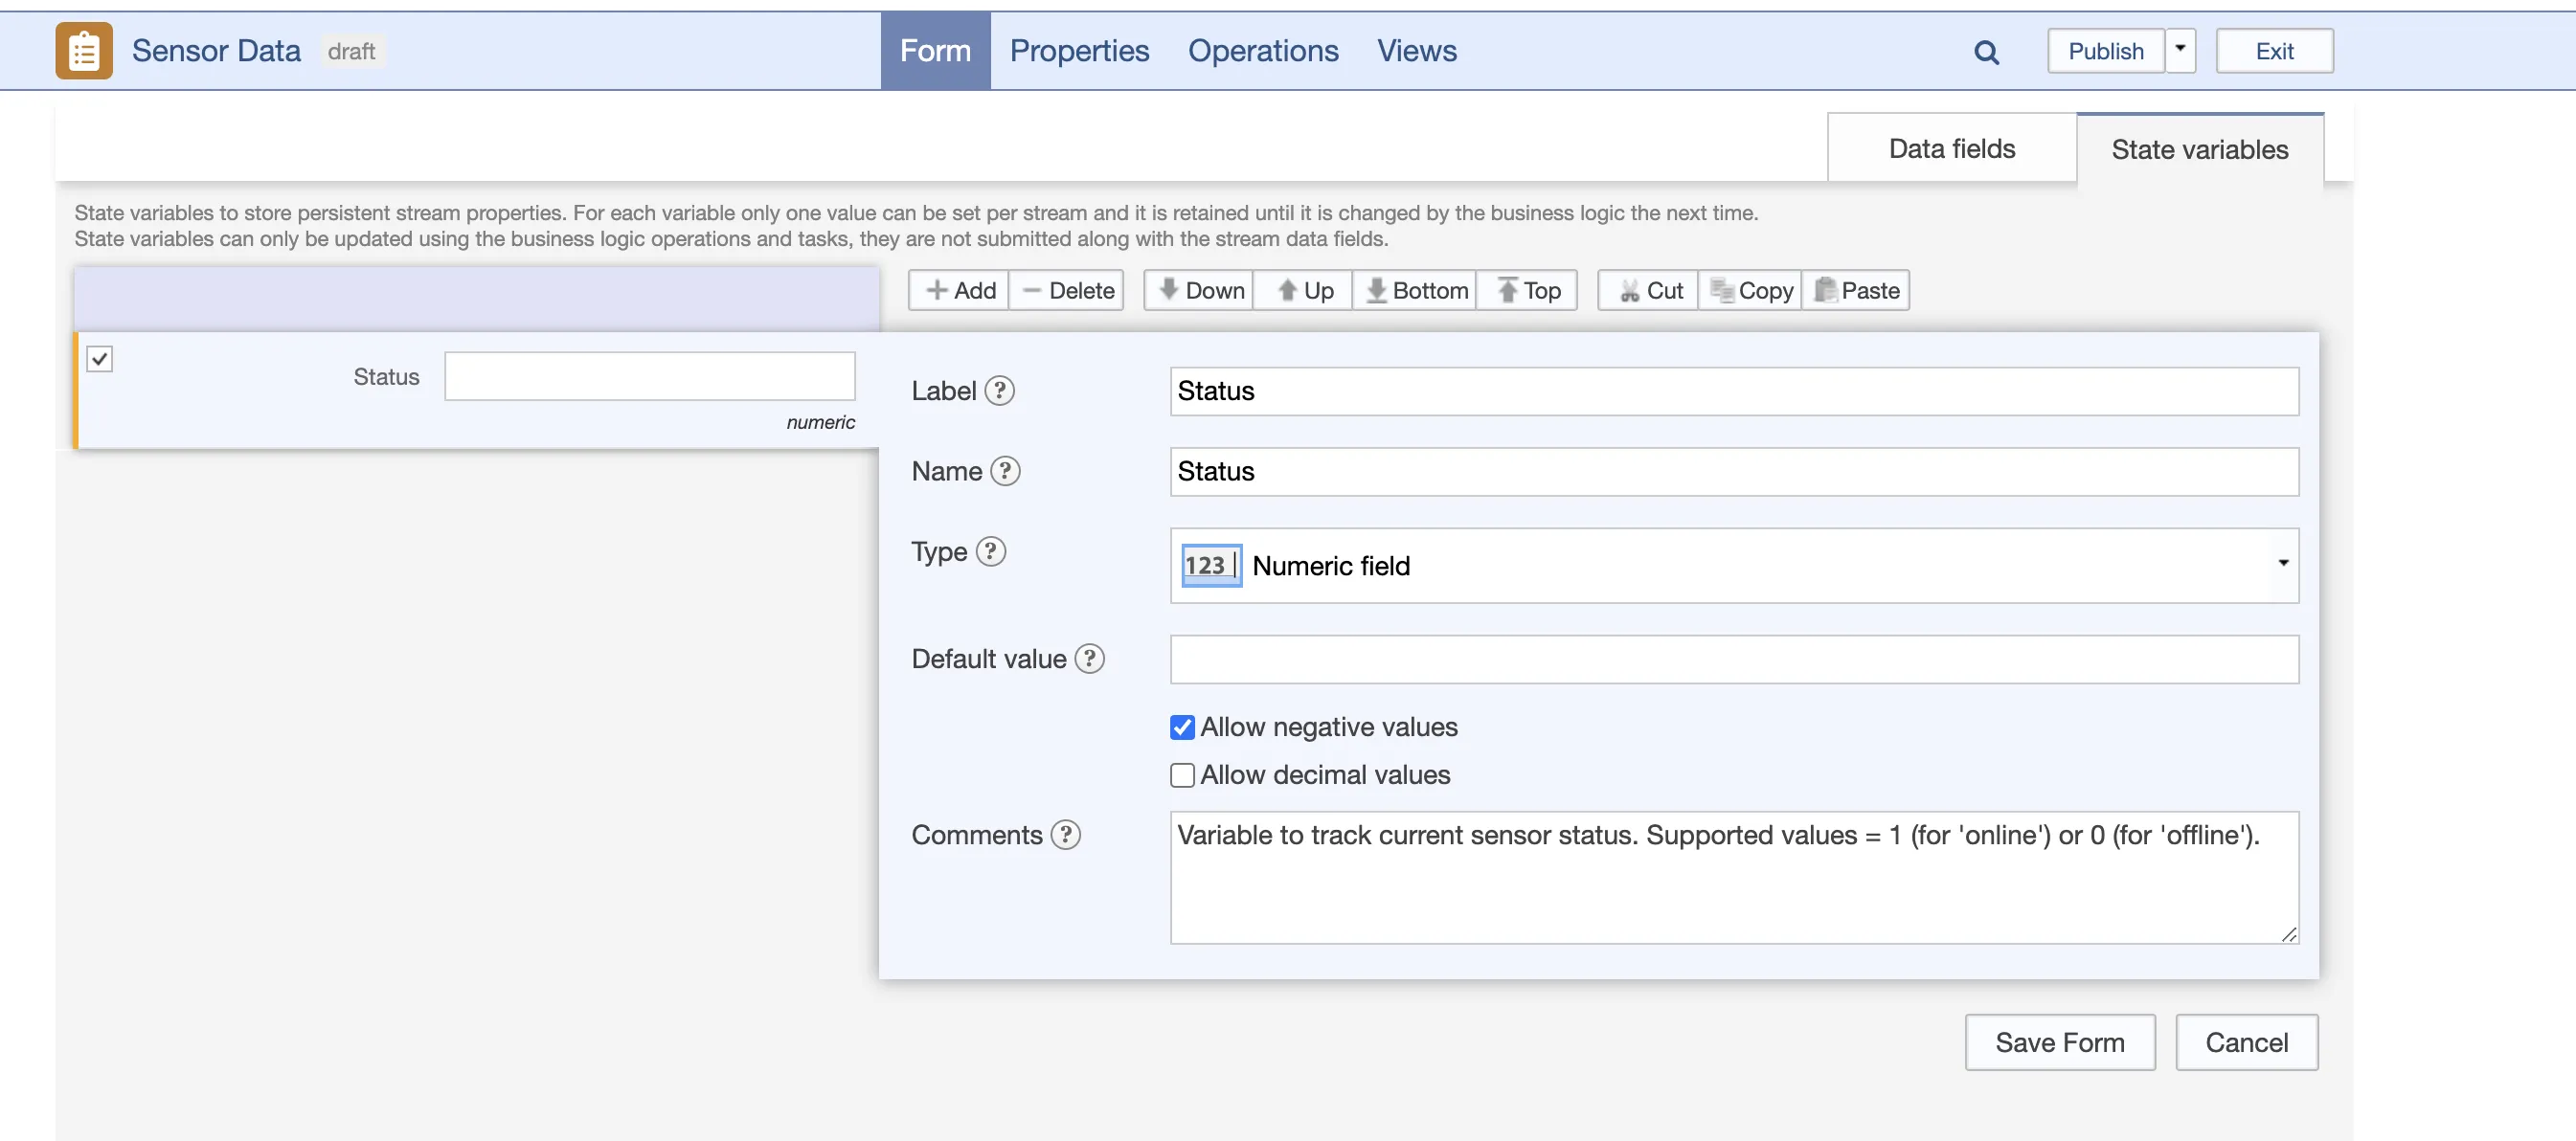
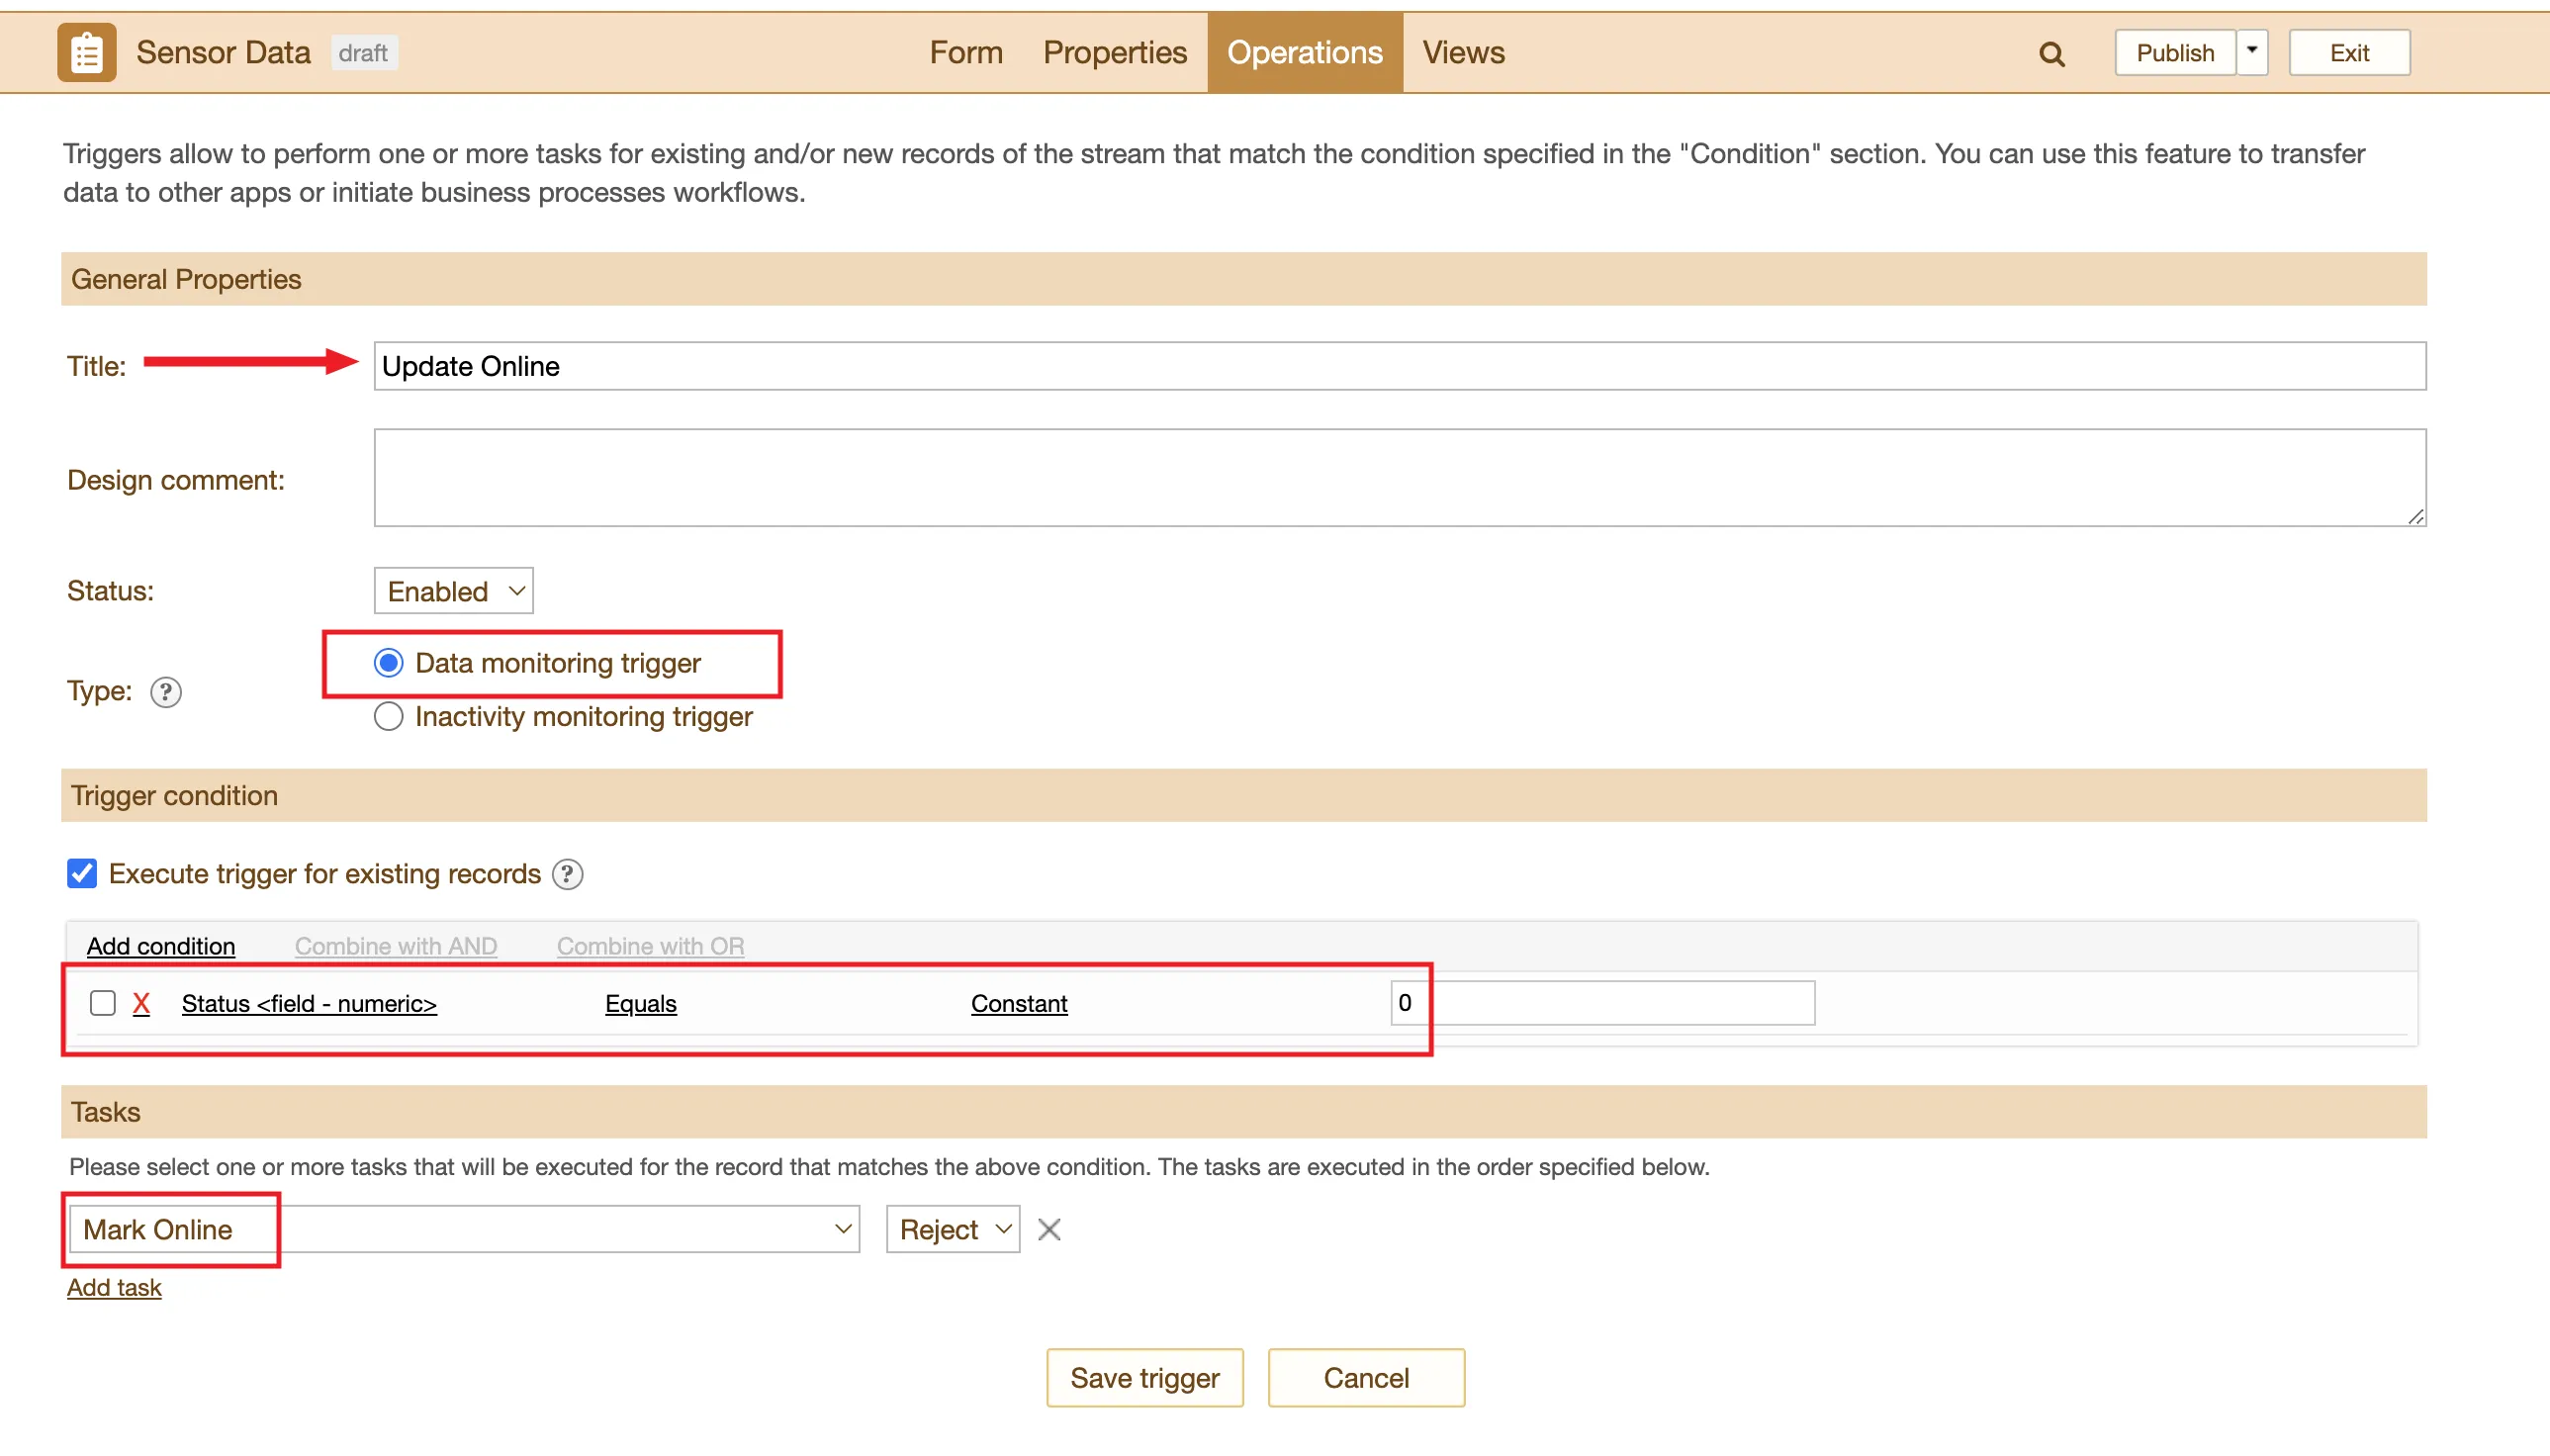
- To track the stream status, we will need to add a task and trigger to the app. First, go to the 'Operations' section and into the 'Tasks' tab.
Click on the 'Add task' button to create a new task.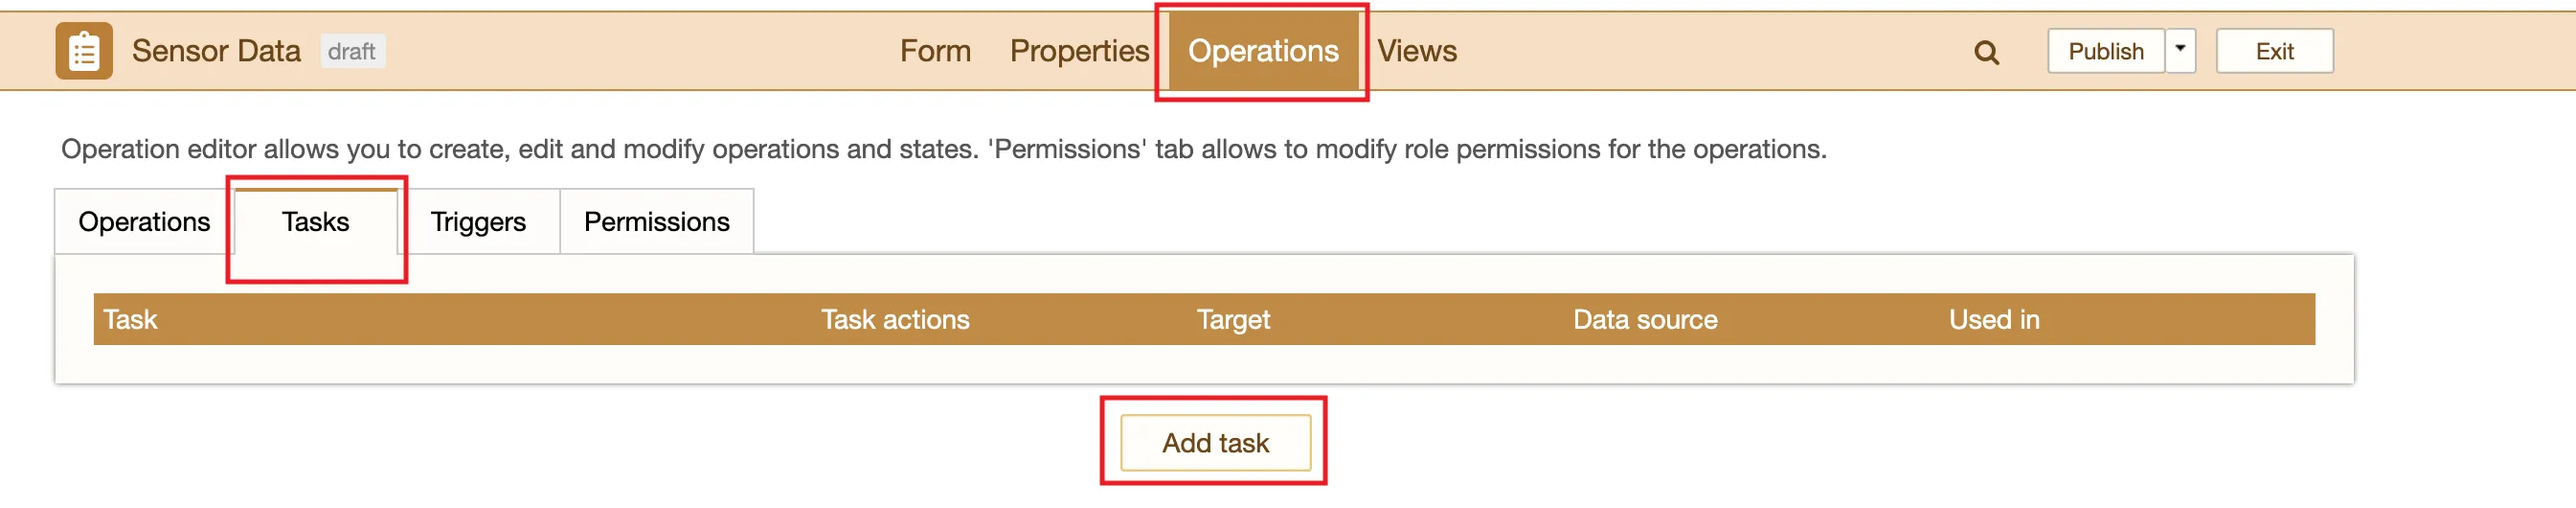
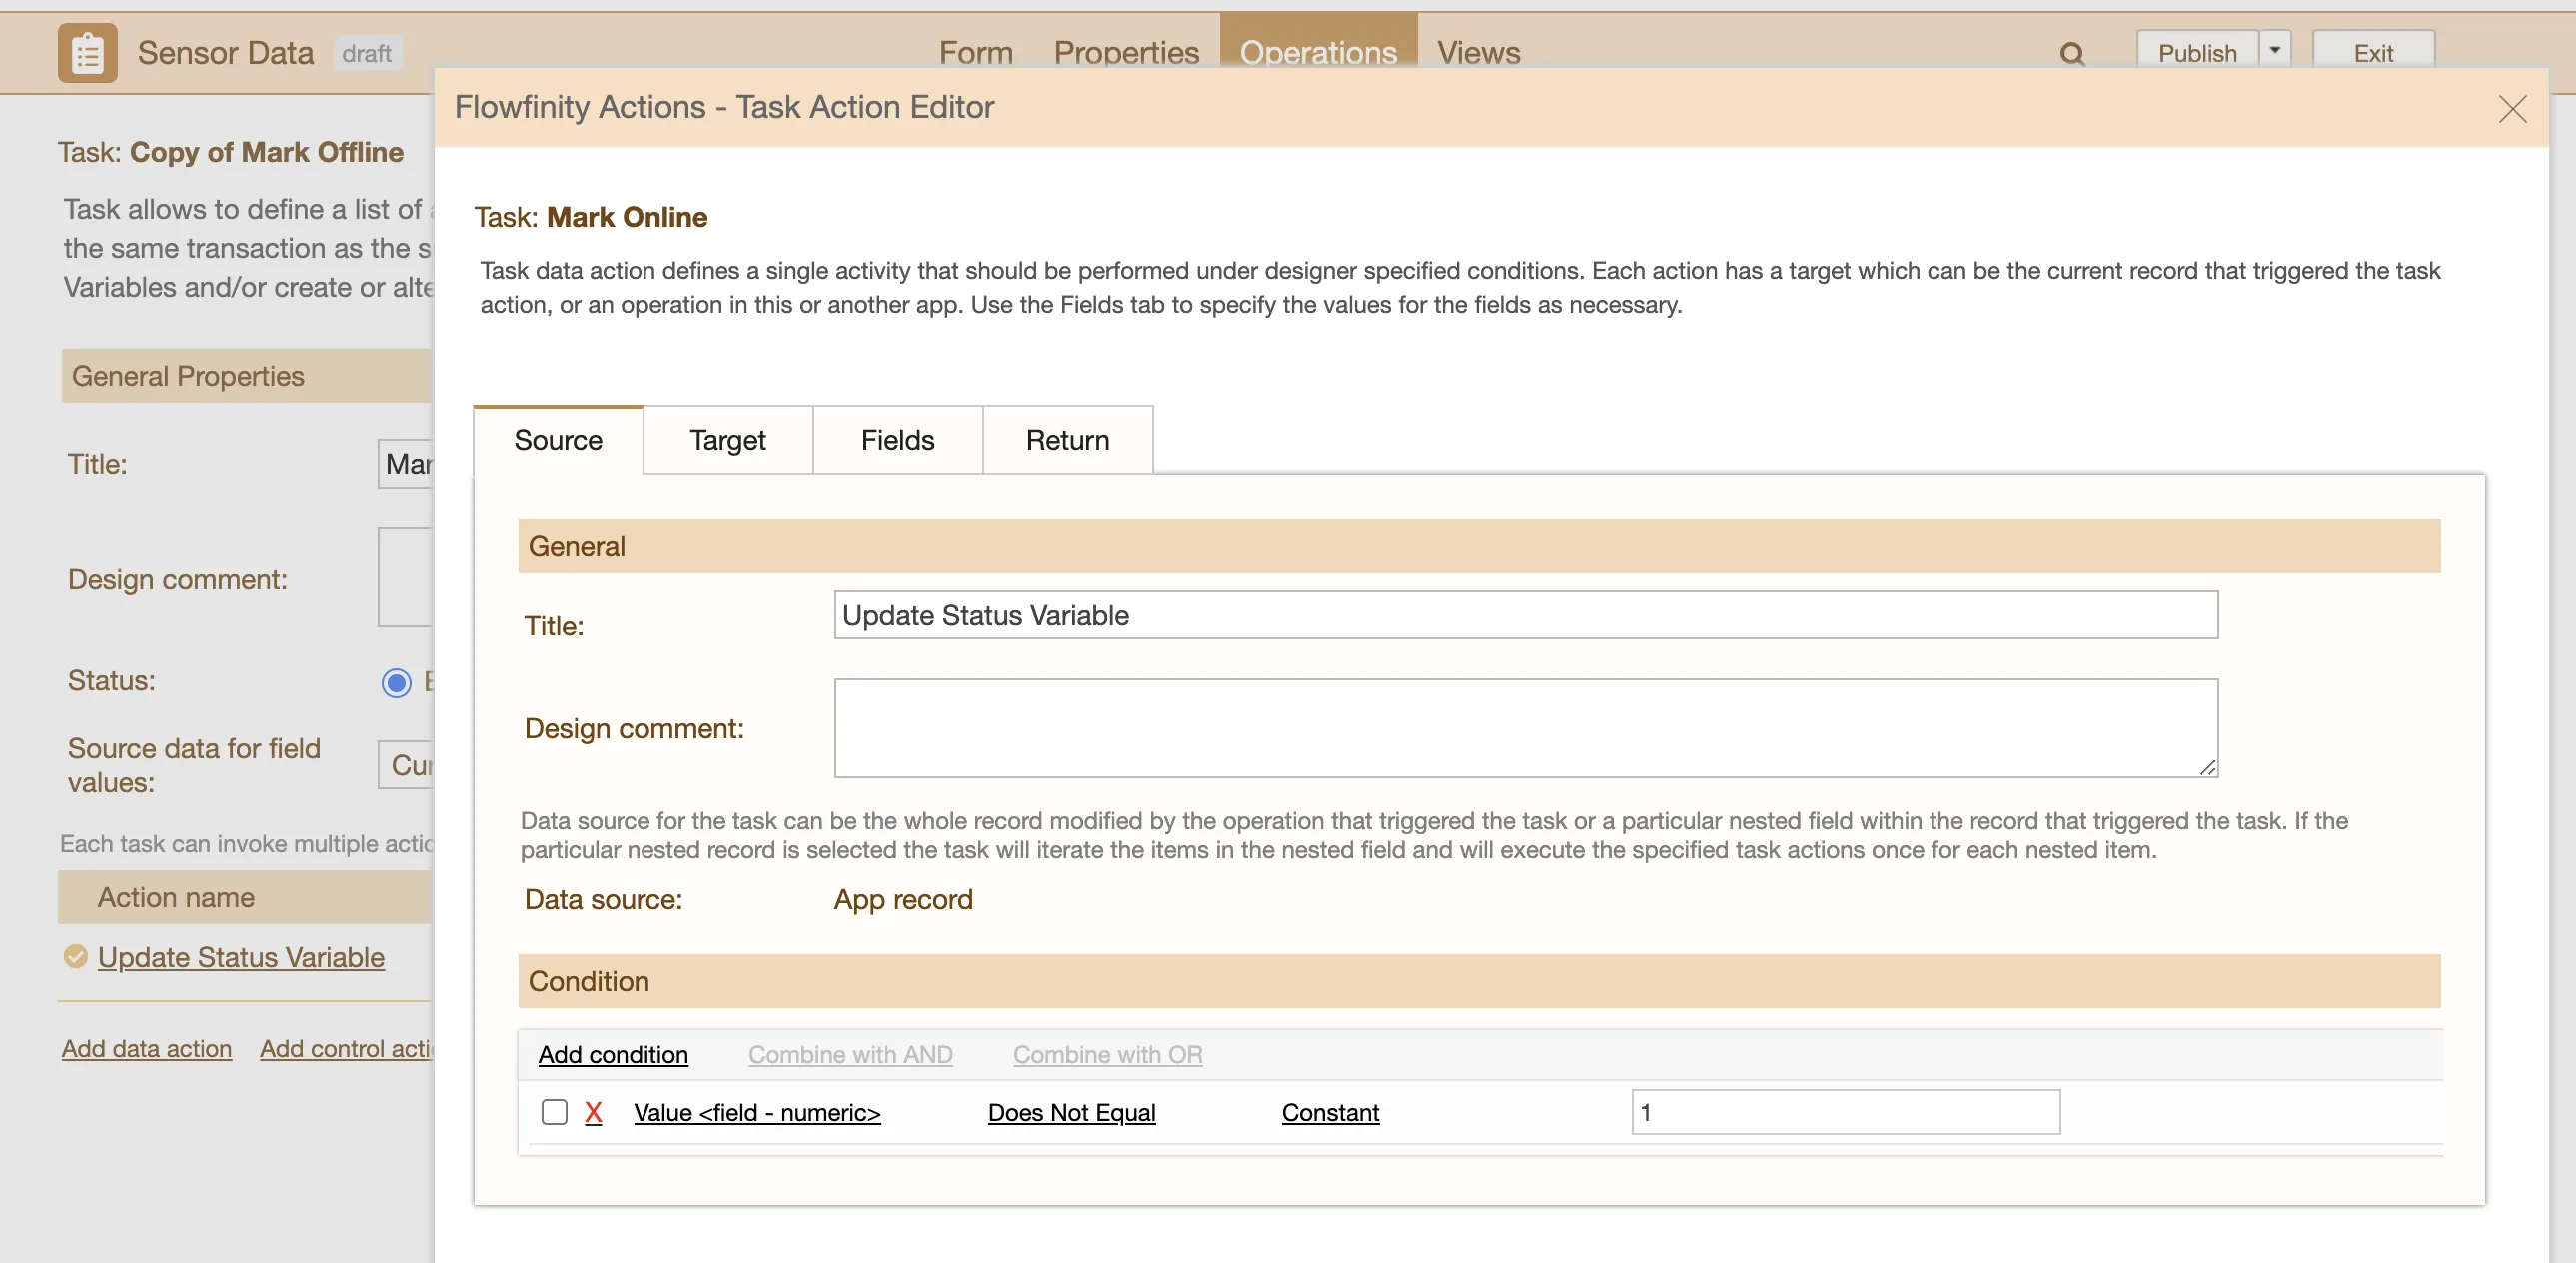
- Within the task configuration pop up, give the task a title (Mark Offline) and then click on the 'Add data action' link to add a new action.
Give a title to the action (Update Status Variable) and add an execution condition to check that the status is not equal to 0 (this is done instead of checking that status equals 1 so that the system returns the correct status when a new sensor is added). This way if stream is already maked as offline the system will not try to update it again.
Status> Does Not Equal > Constant > 0 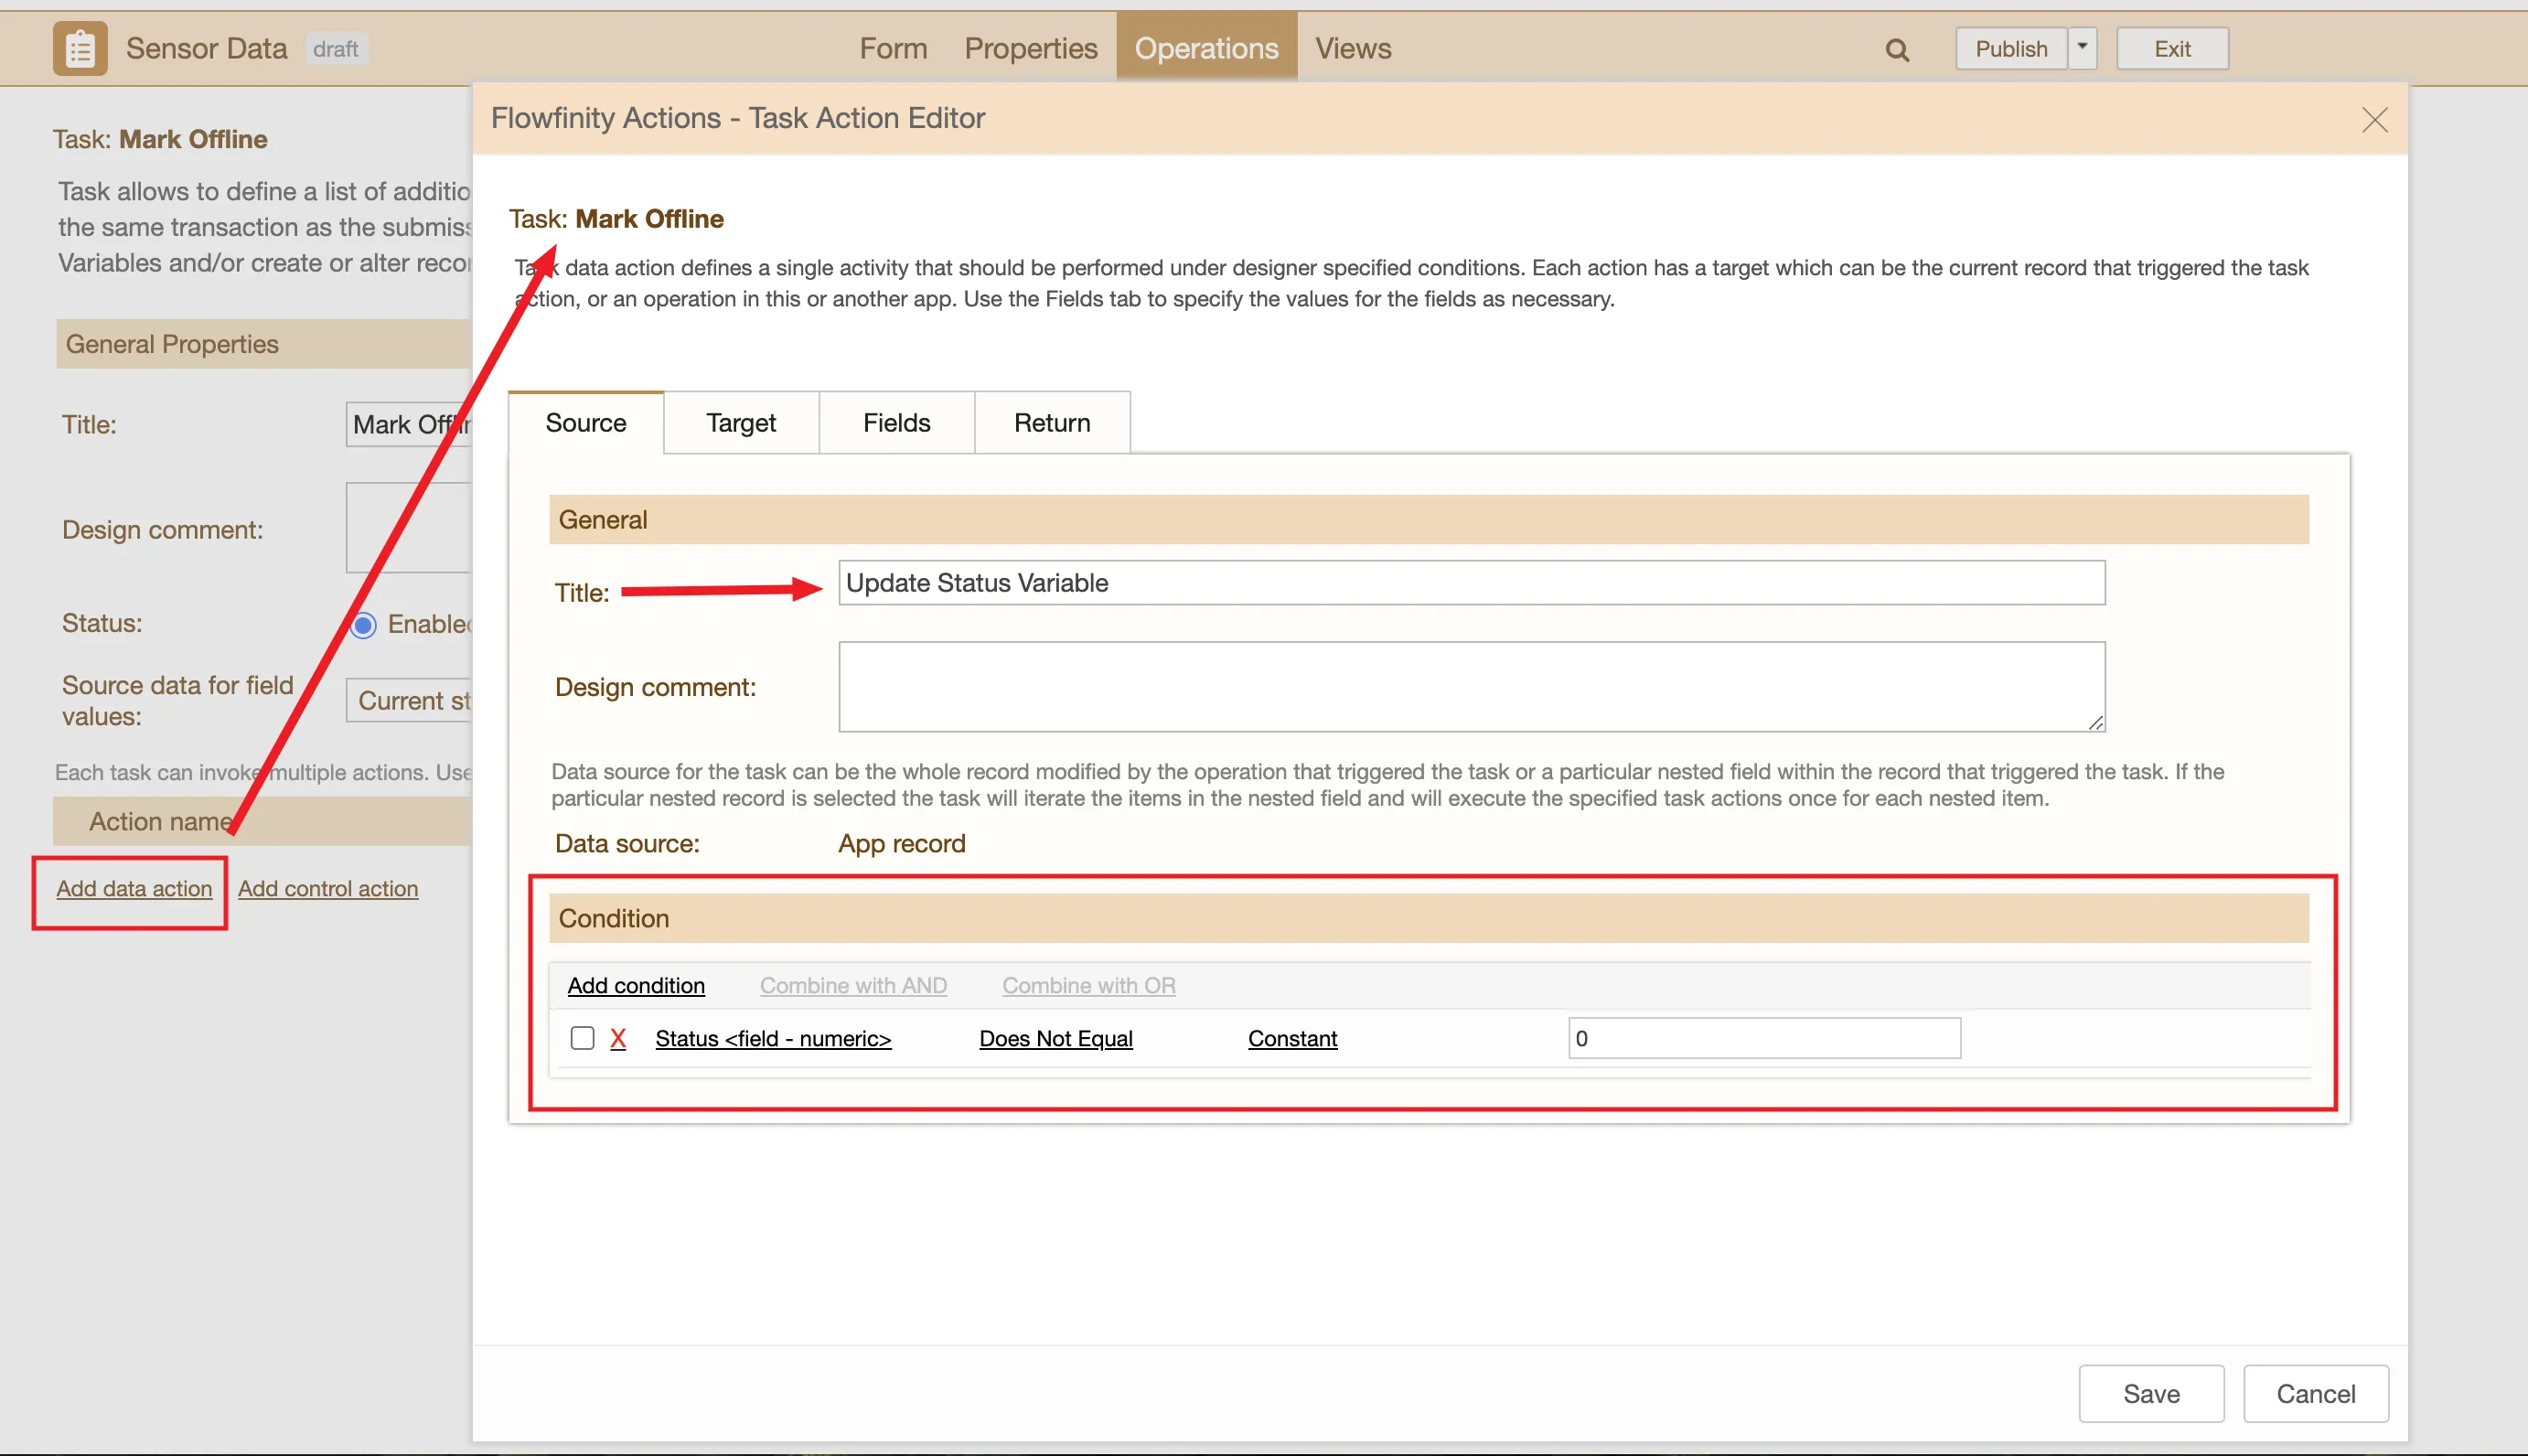
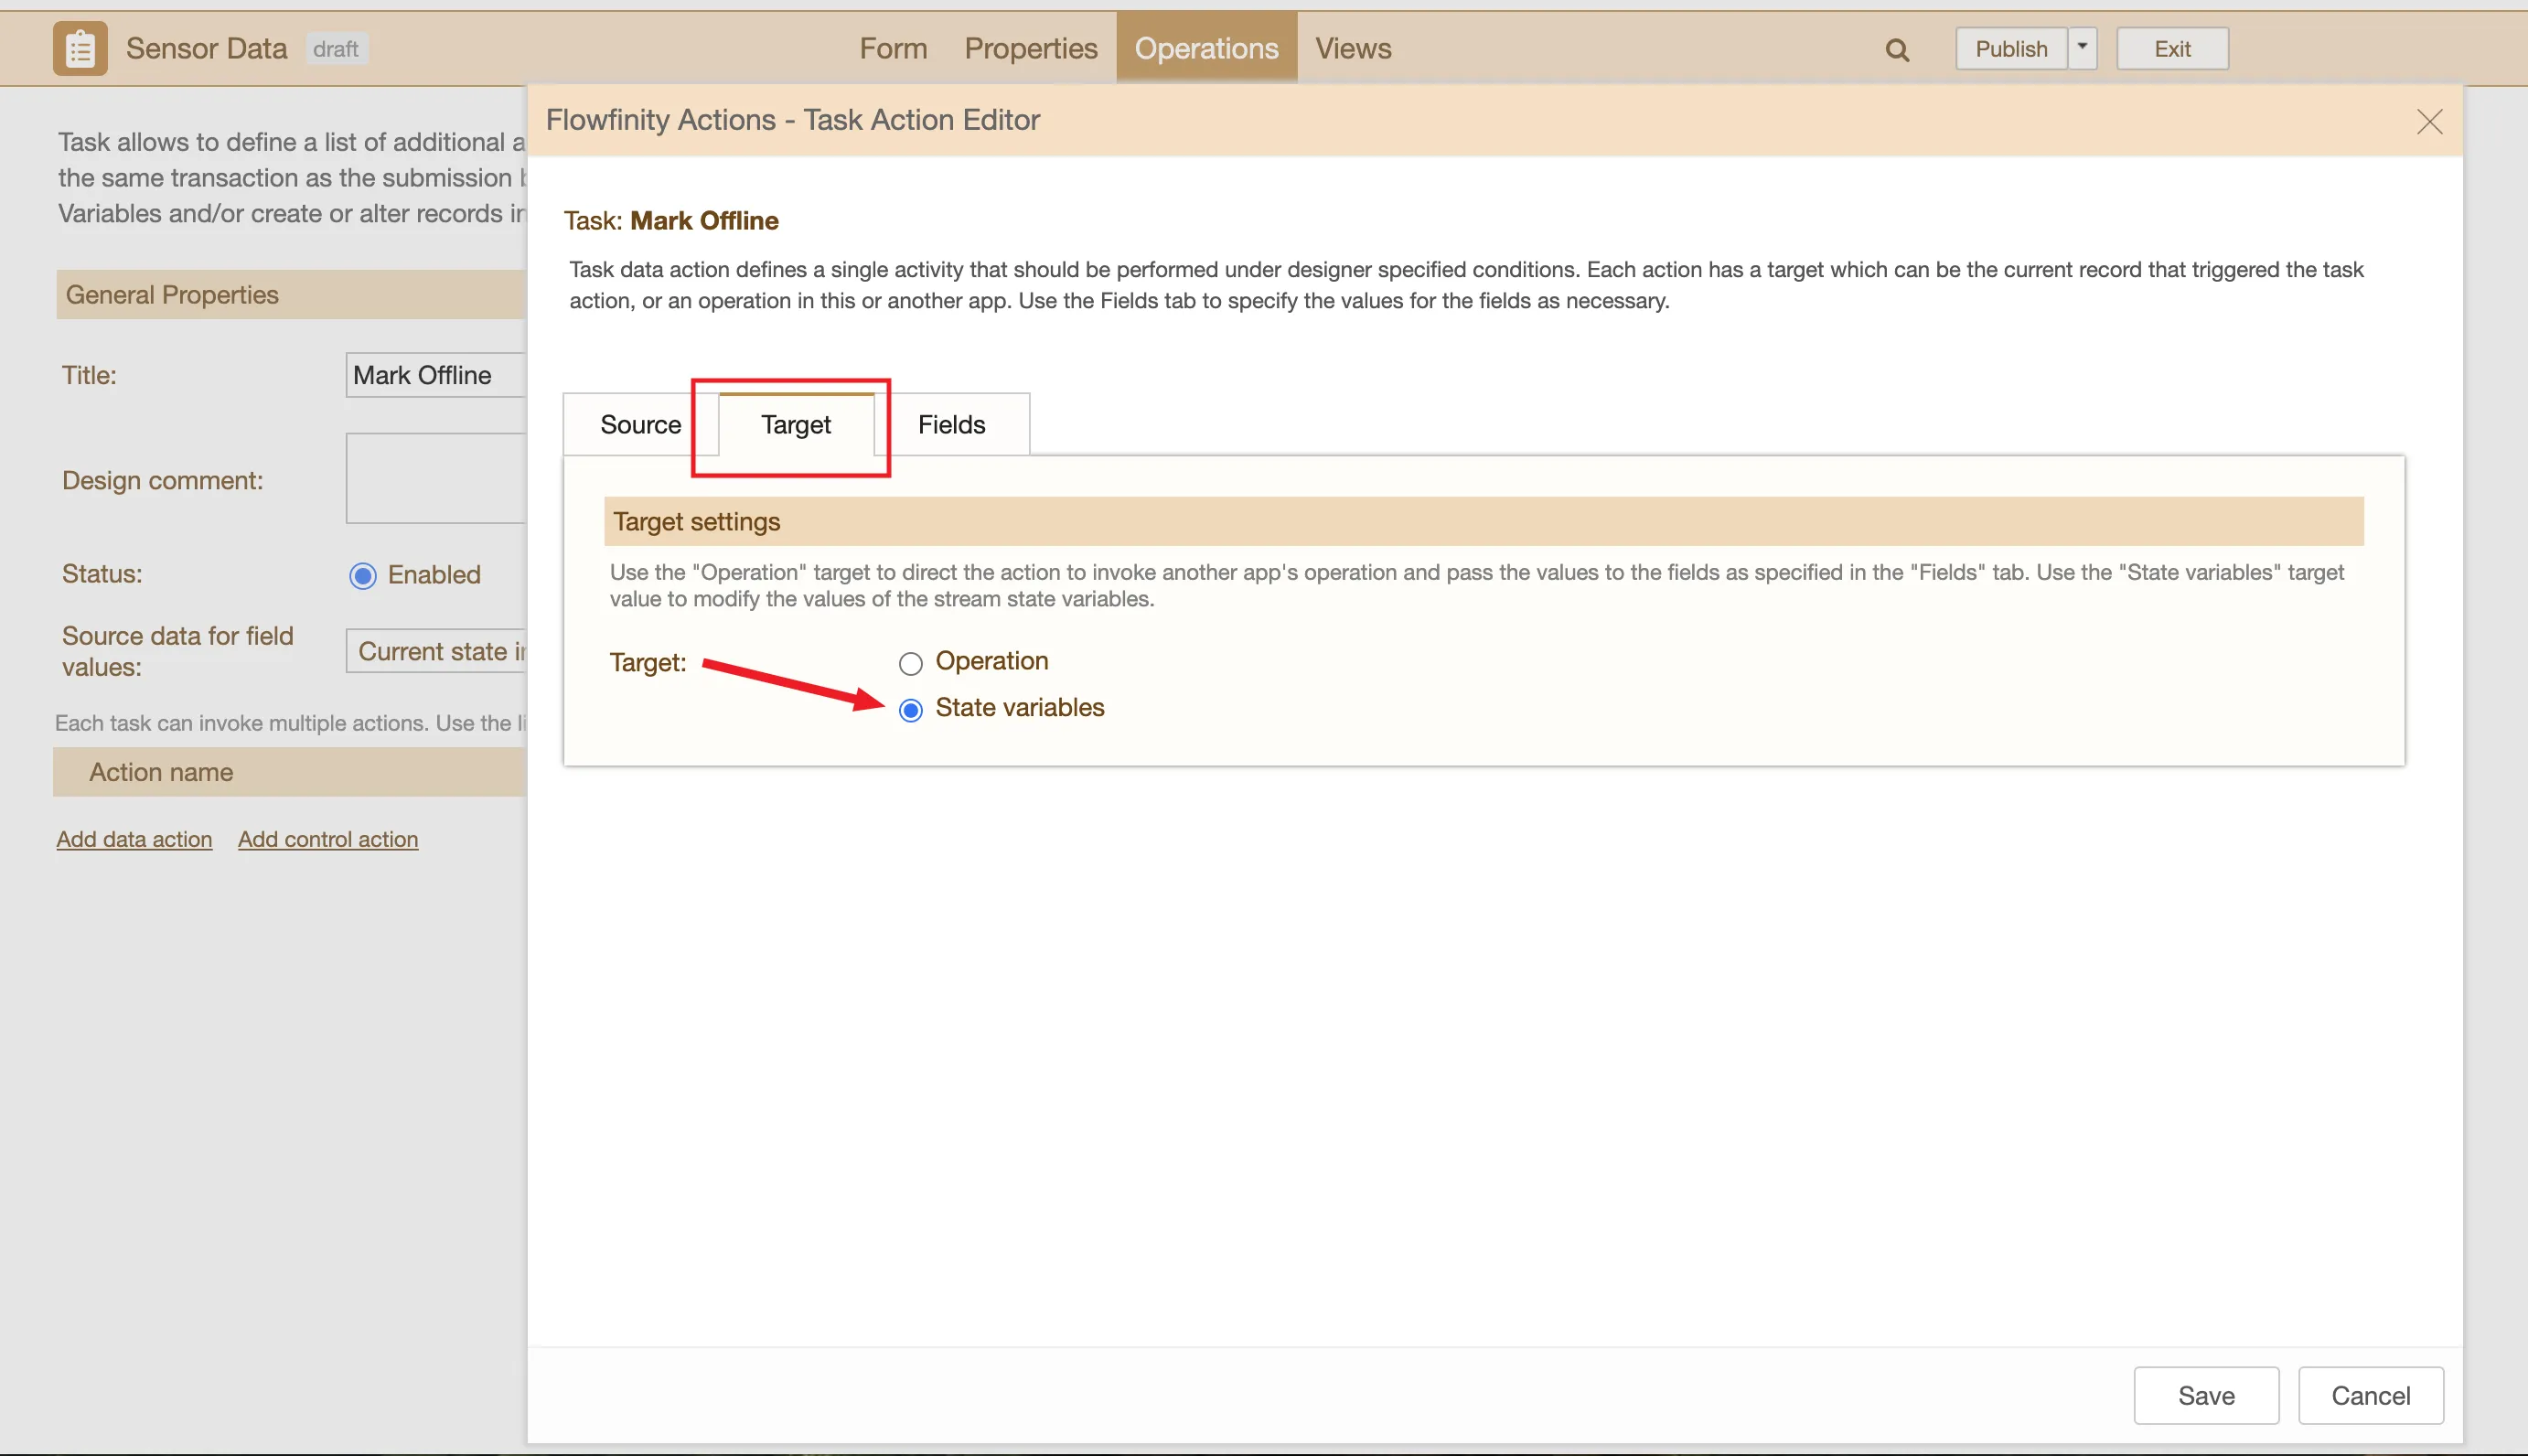
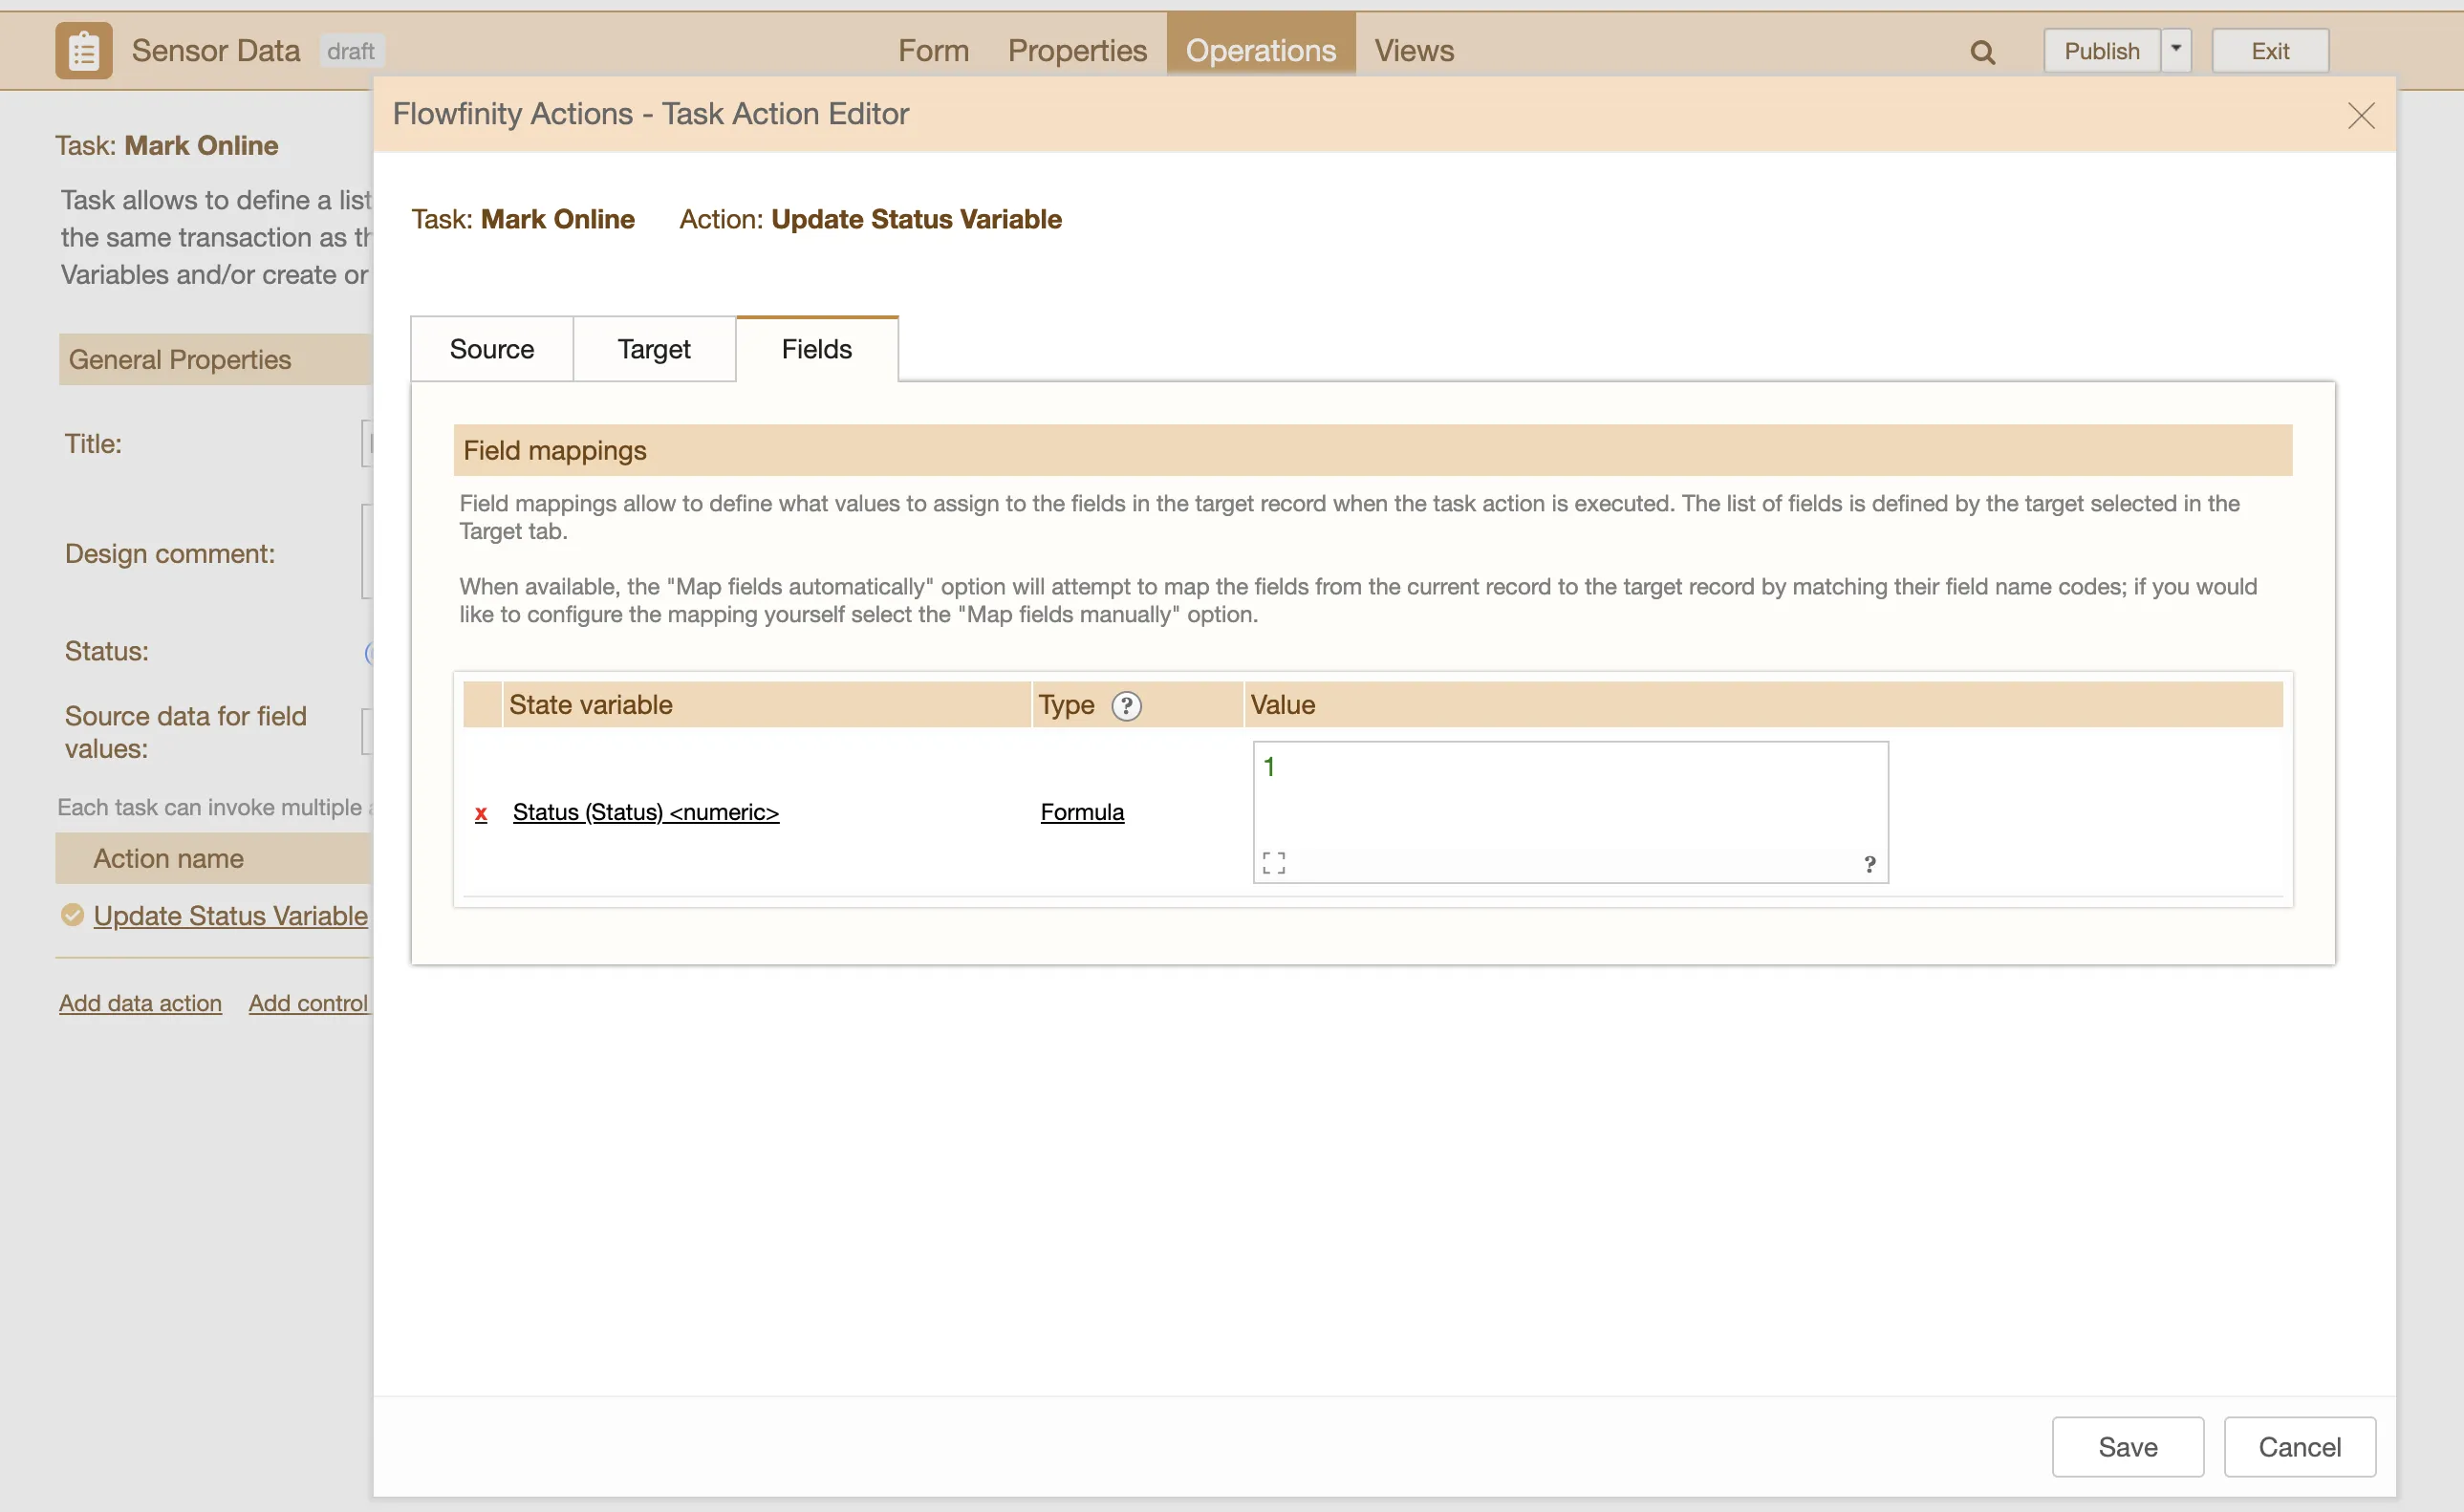
- Switch to the 'Target' tab and change the 'Target' selection to 'State Variable'.
- Switch to the 'Fields' tab to map your field to a state variable. Click 'Add mapping'. Set the 'State Variable' to 'Status
, the 'Type' to Const(ant), and the 'Value' to 0 (offline). 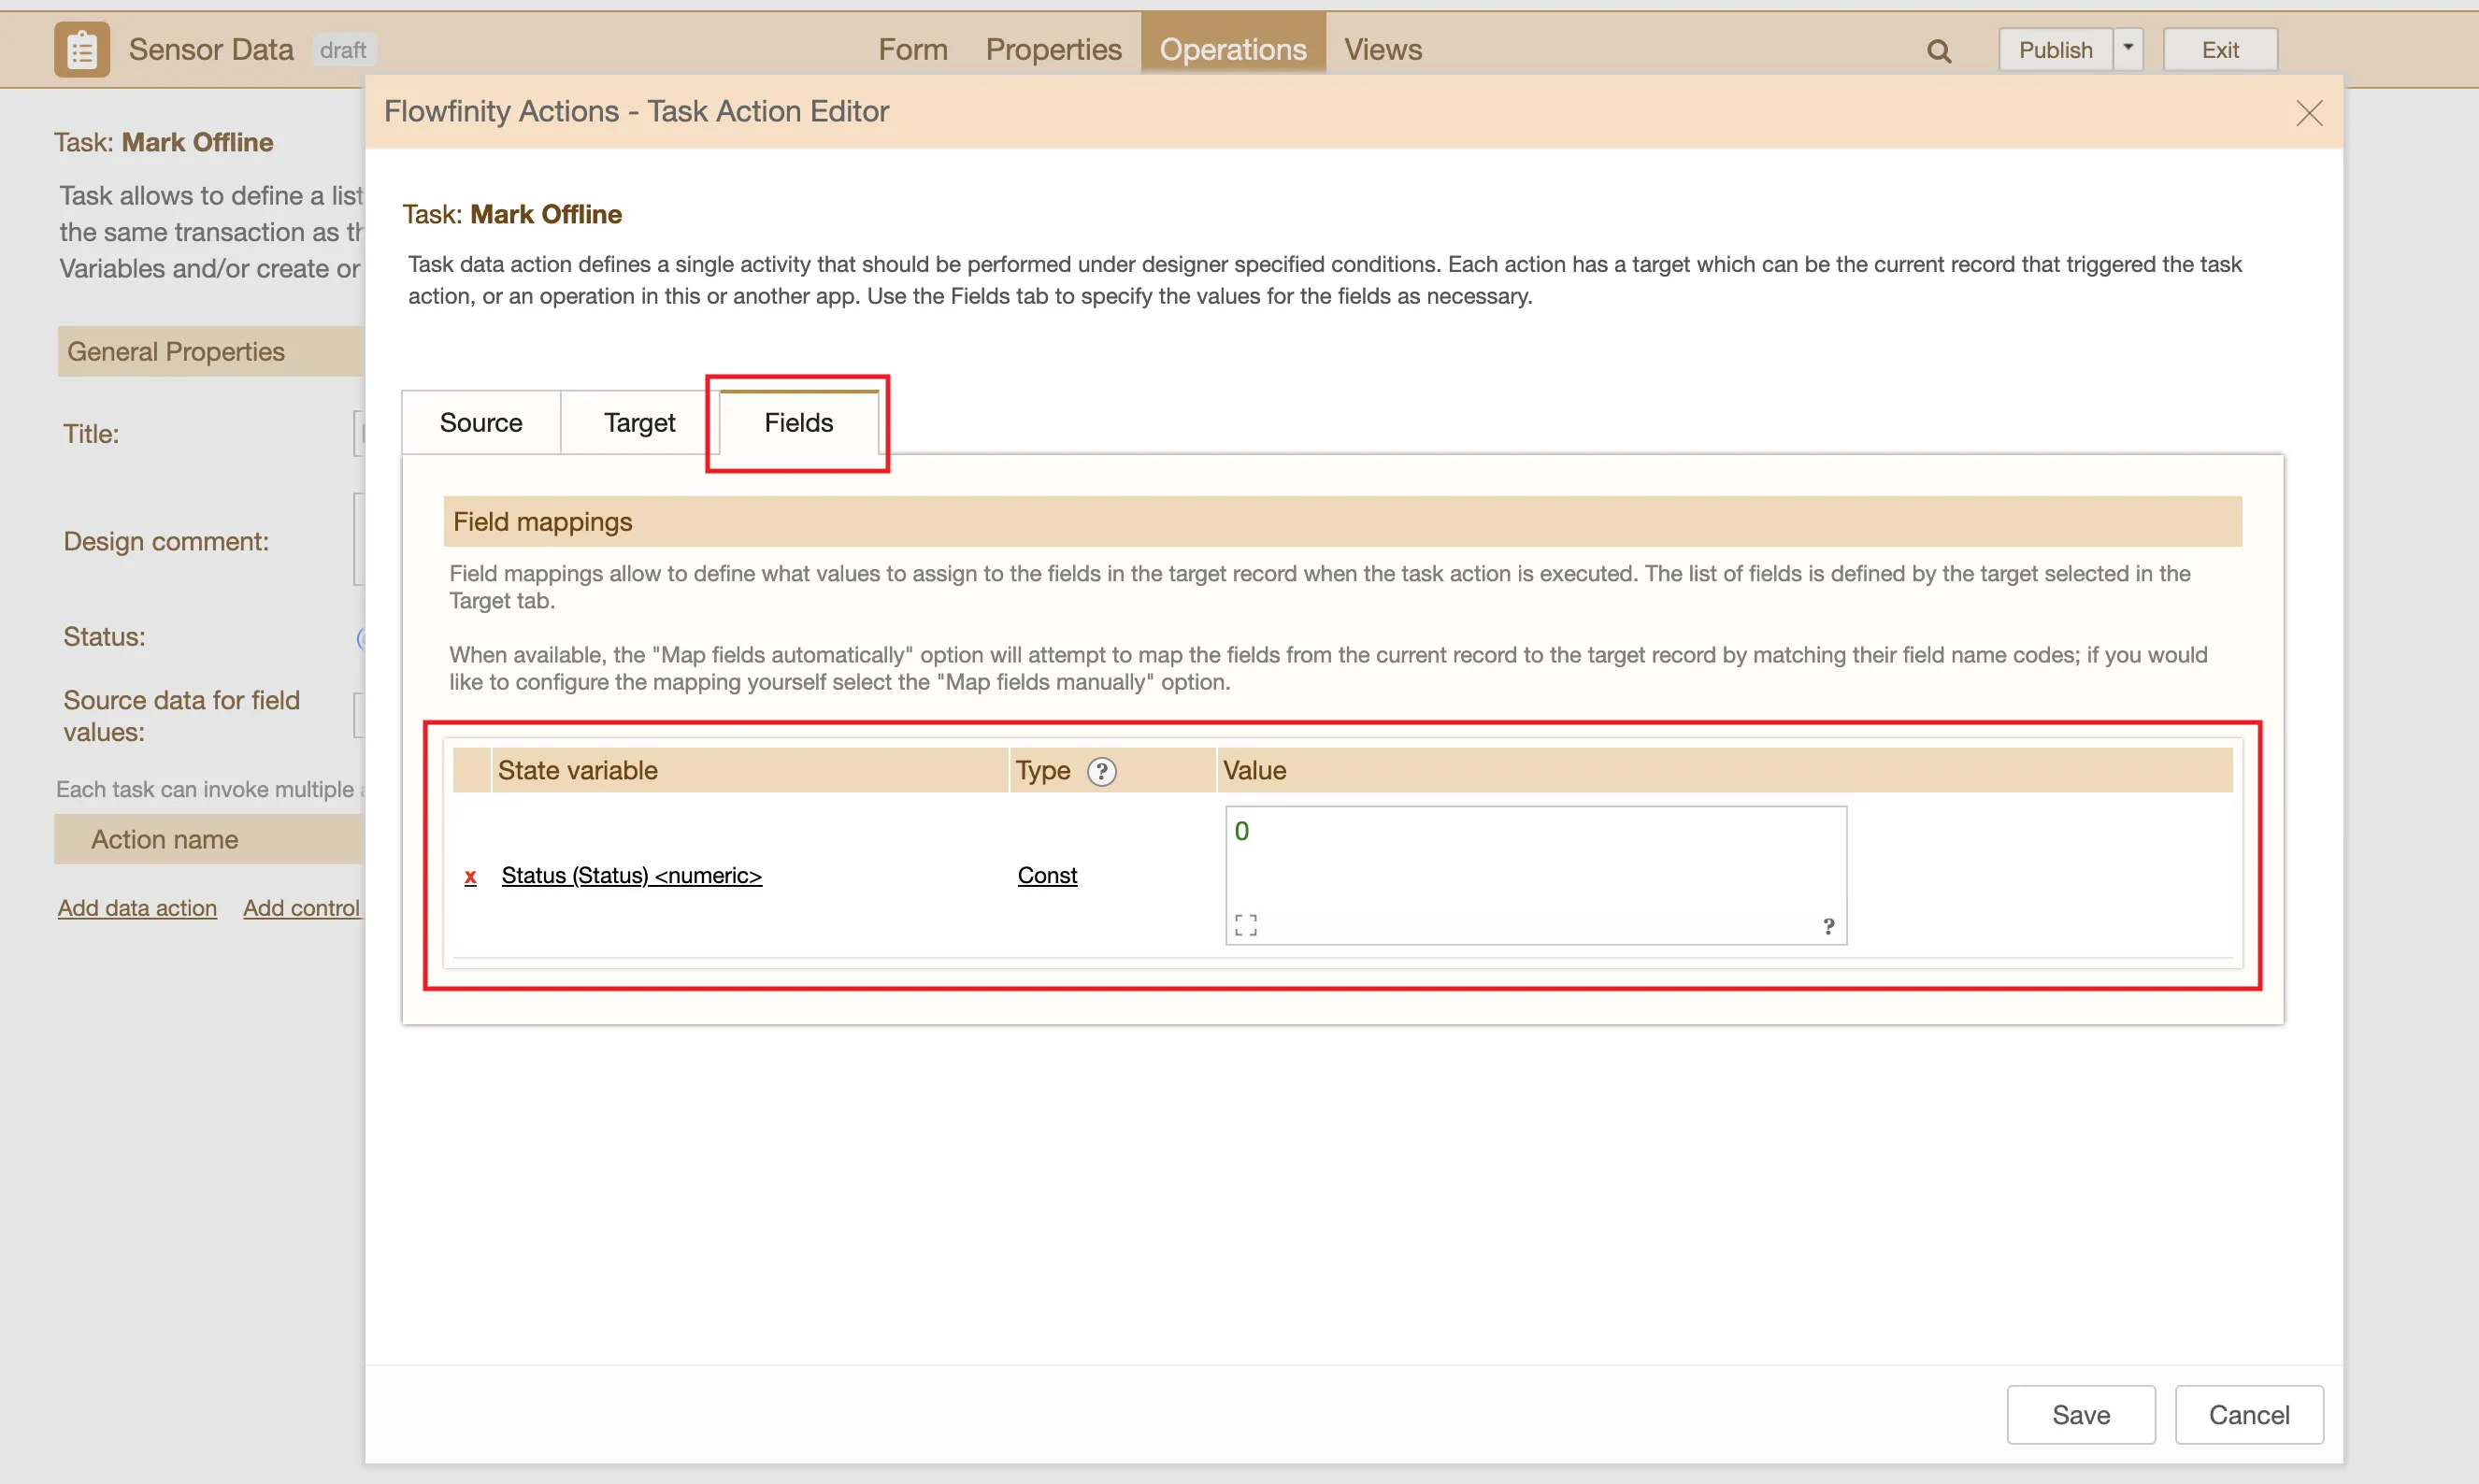
- Save the task and then set up another task, that will esentially invesrese of the first task – resetting the stream to display as 'Online' when a submission comes through and changes the numeric status back to 1.
You can use the 'Copy Task' option from the drop down on the first task to create a new task and then modify its title, trigger condition for the action and the target value that status variable will be set to 'Status', with a 'Value' of 1. 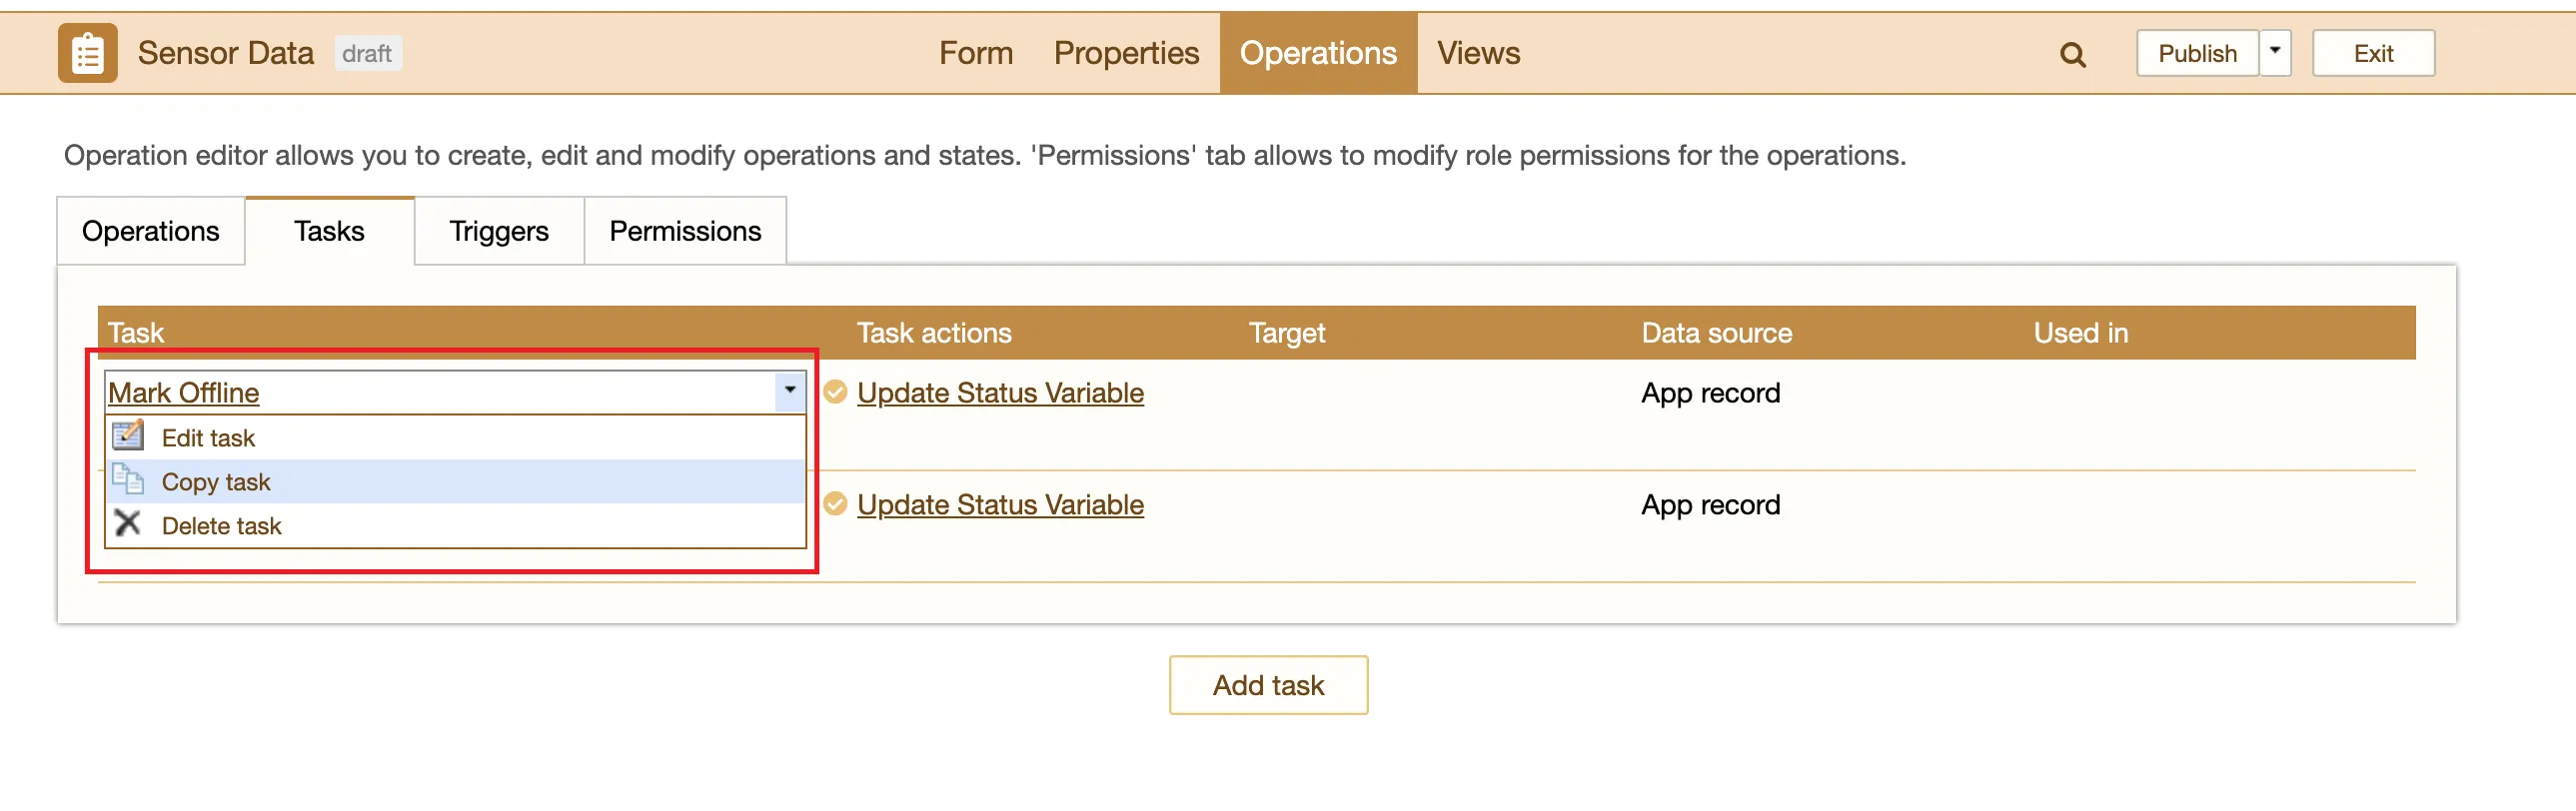
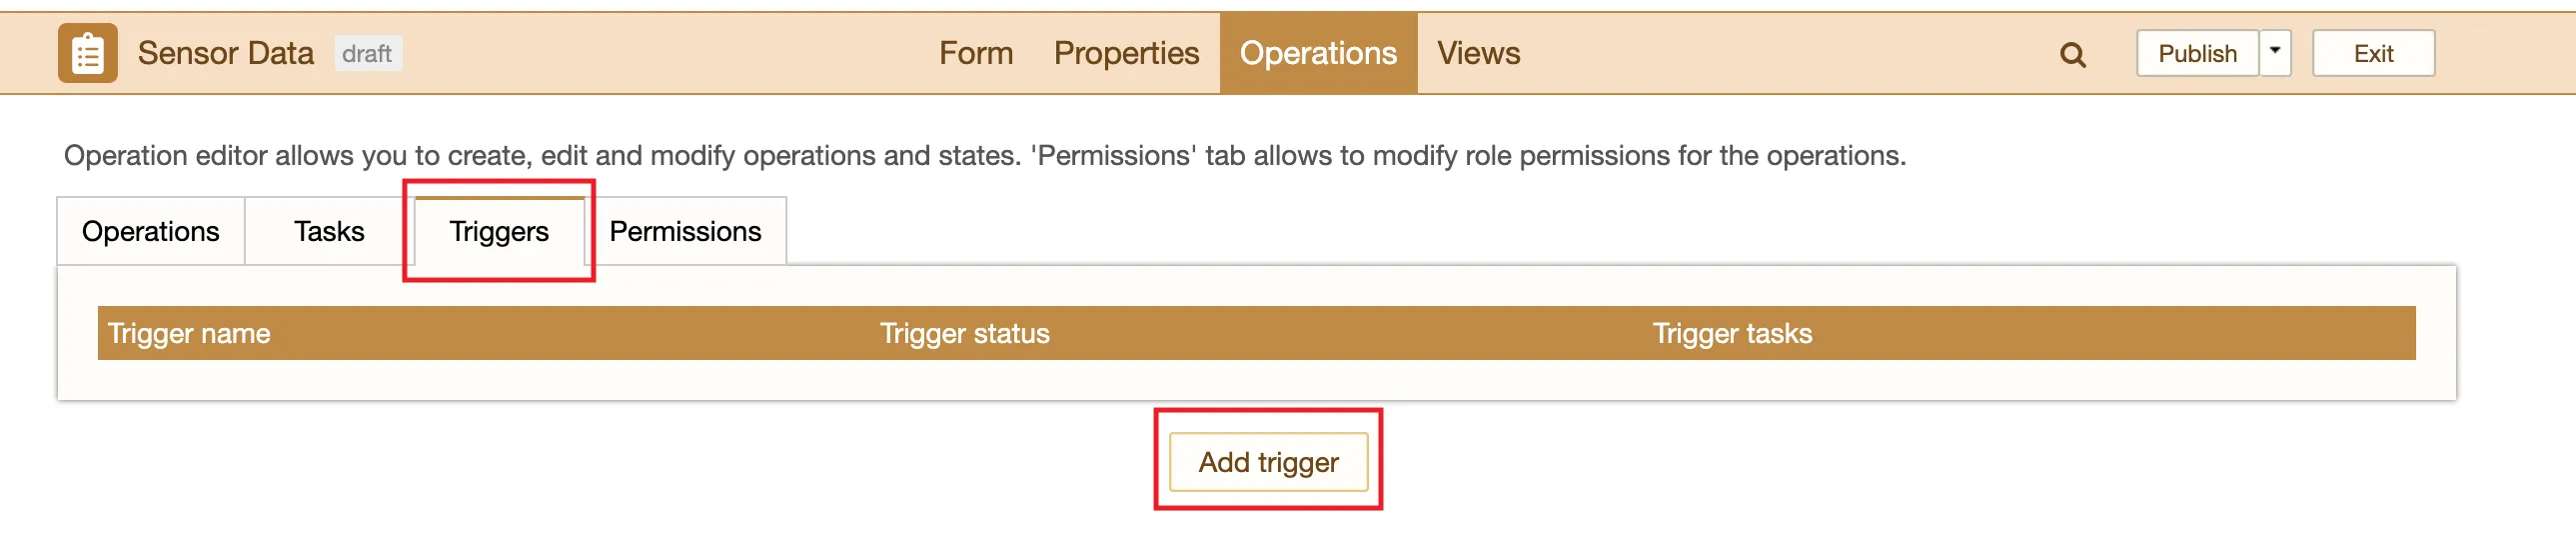
- Next add a Trigger to the system to detect when the stream goes offline or online. Switch to the 'Triggers' tab and then click on the 'Add trigger' button to add a new trigger.
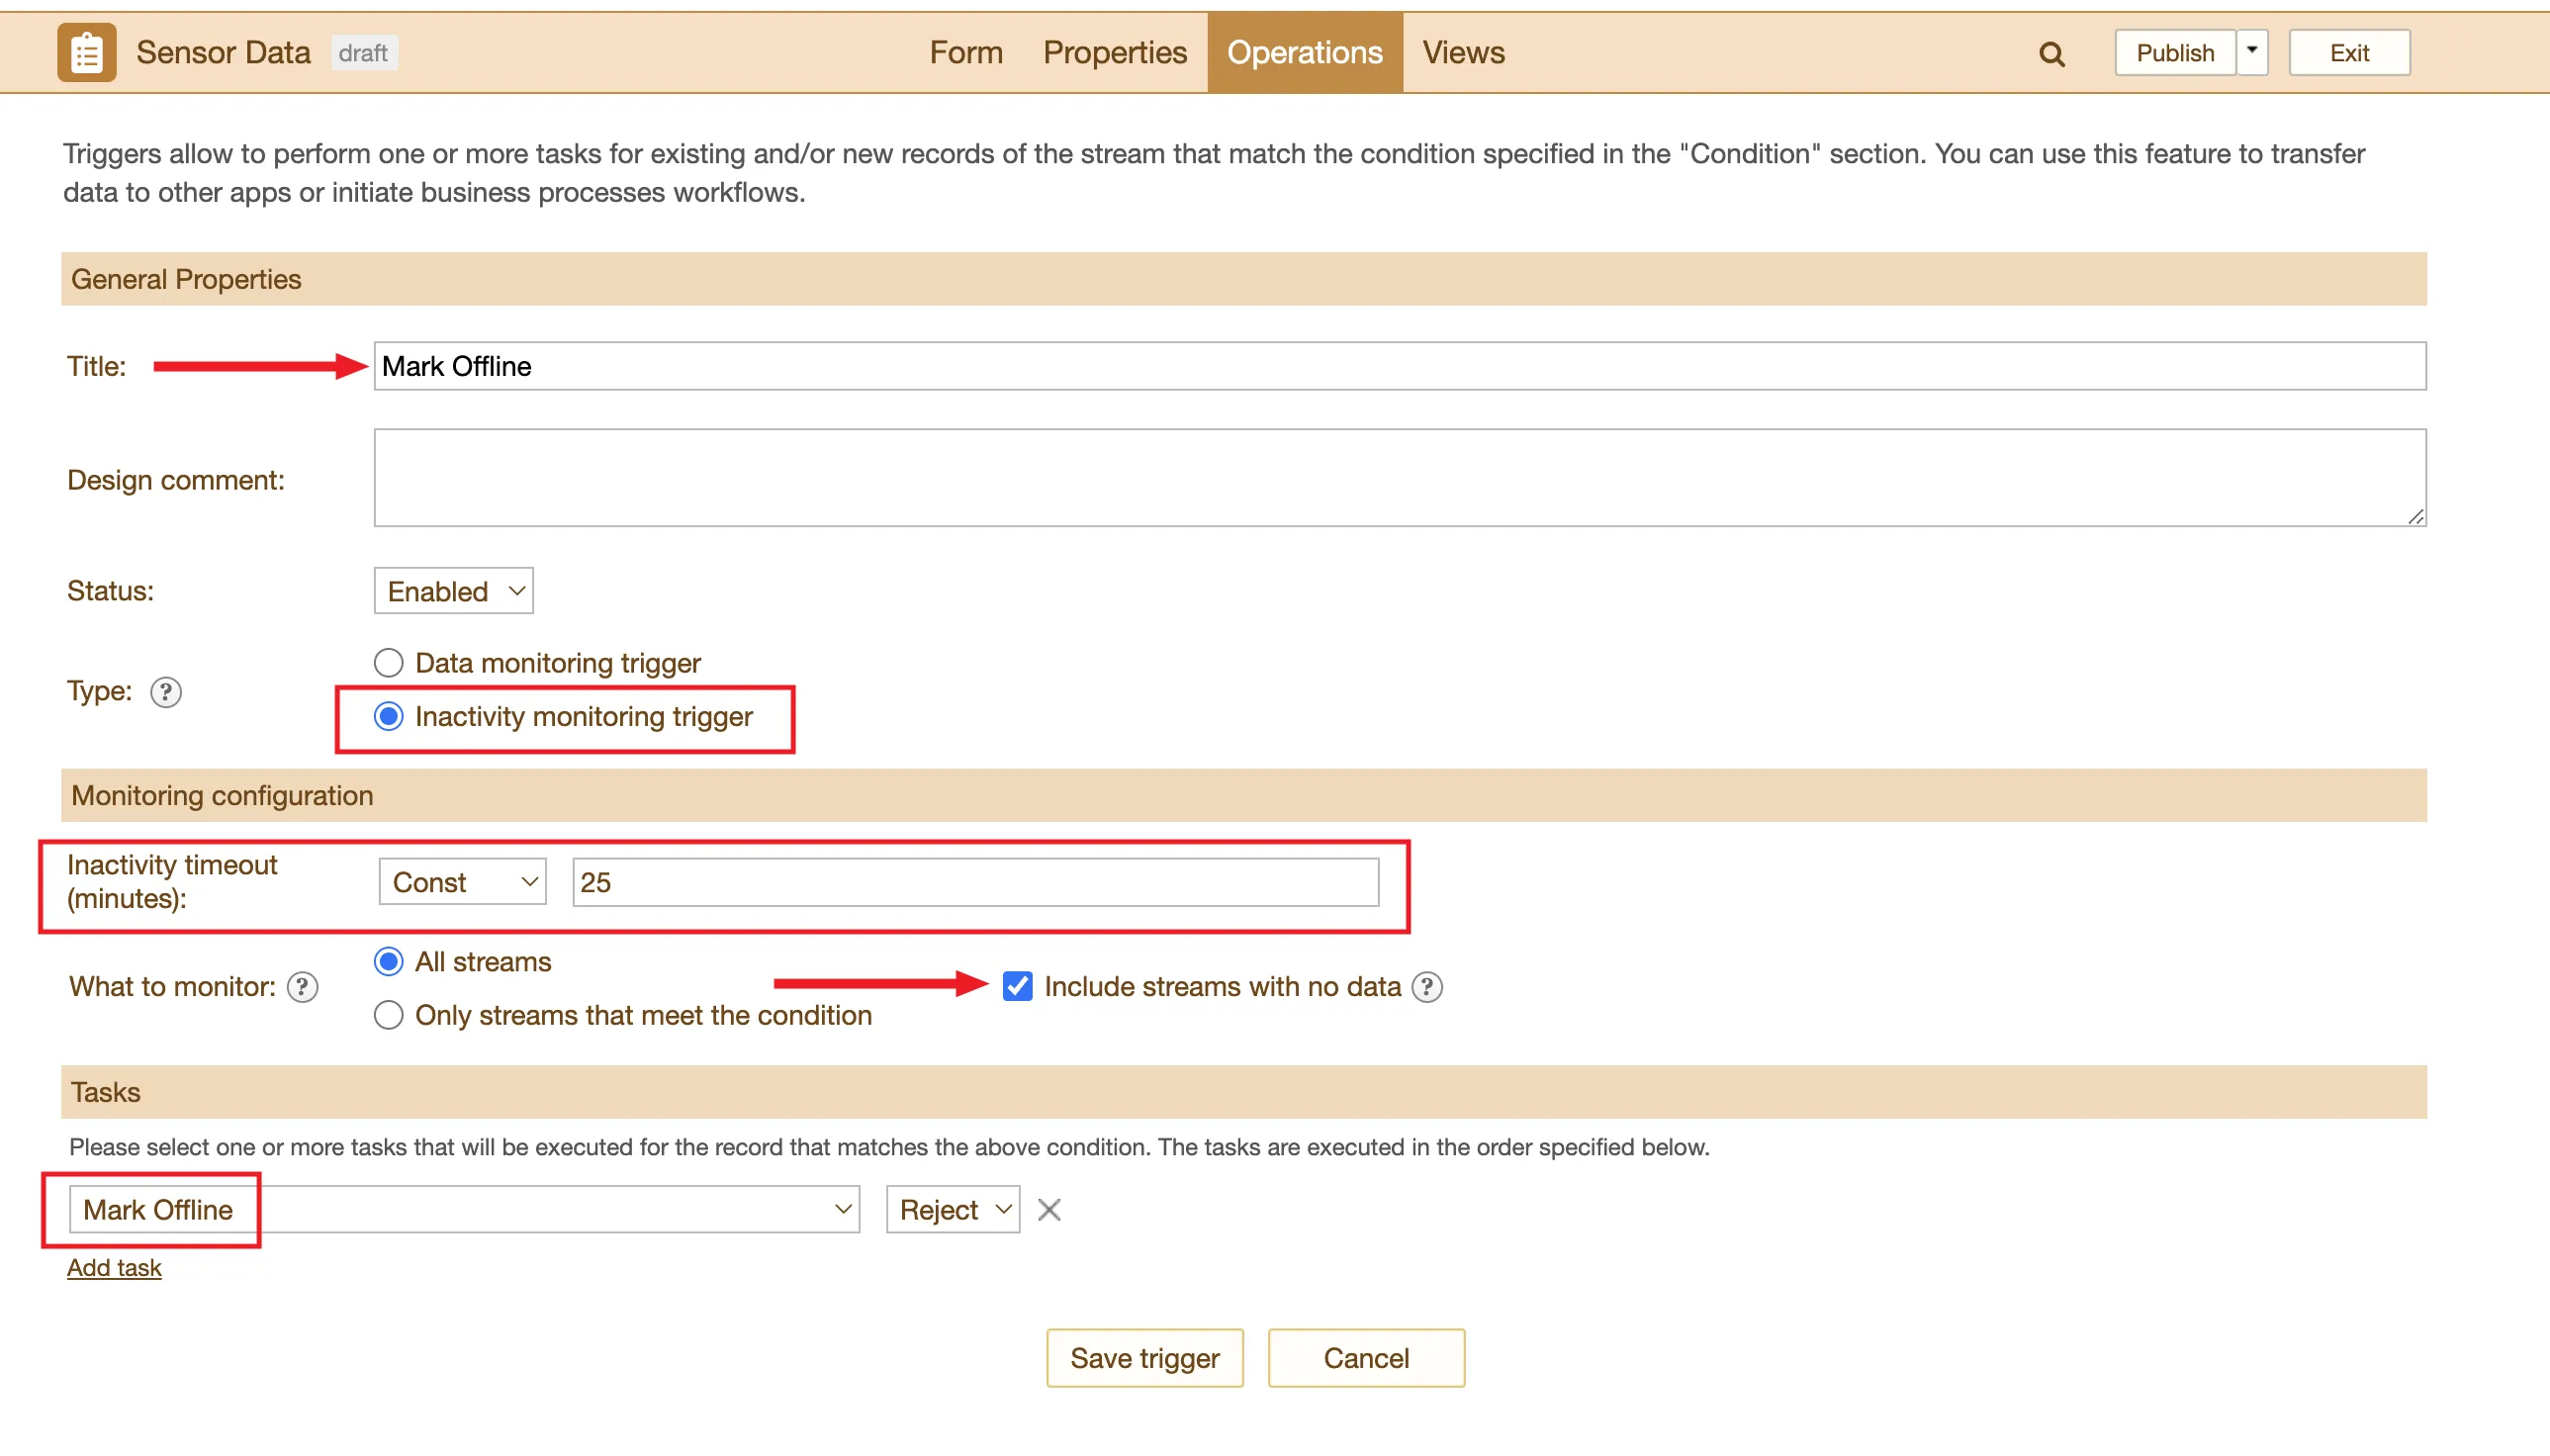
- In the trigger editor change 'Type'radio button to 'Inactivity monitoring trigger', then configure the 'Inactivity timeout' setting as 'Const' at a time interval of your choosing. Then add the 'Task' that should be executed, 'Mark Offline'. Save trigger.
- Add another trigger that will be executed when a submission comes though to change the status back to online. For this trigger add a condition that the status equals to 0 (offline) so that this trigger is only executed at first submission after device went offline. Save trigger.
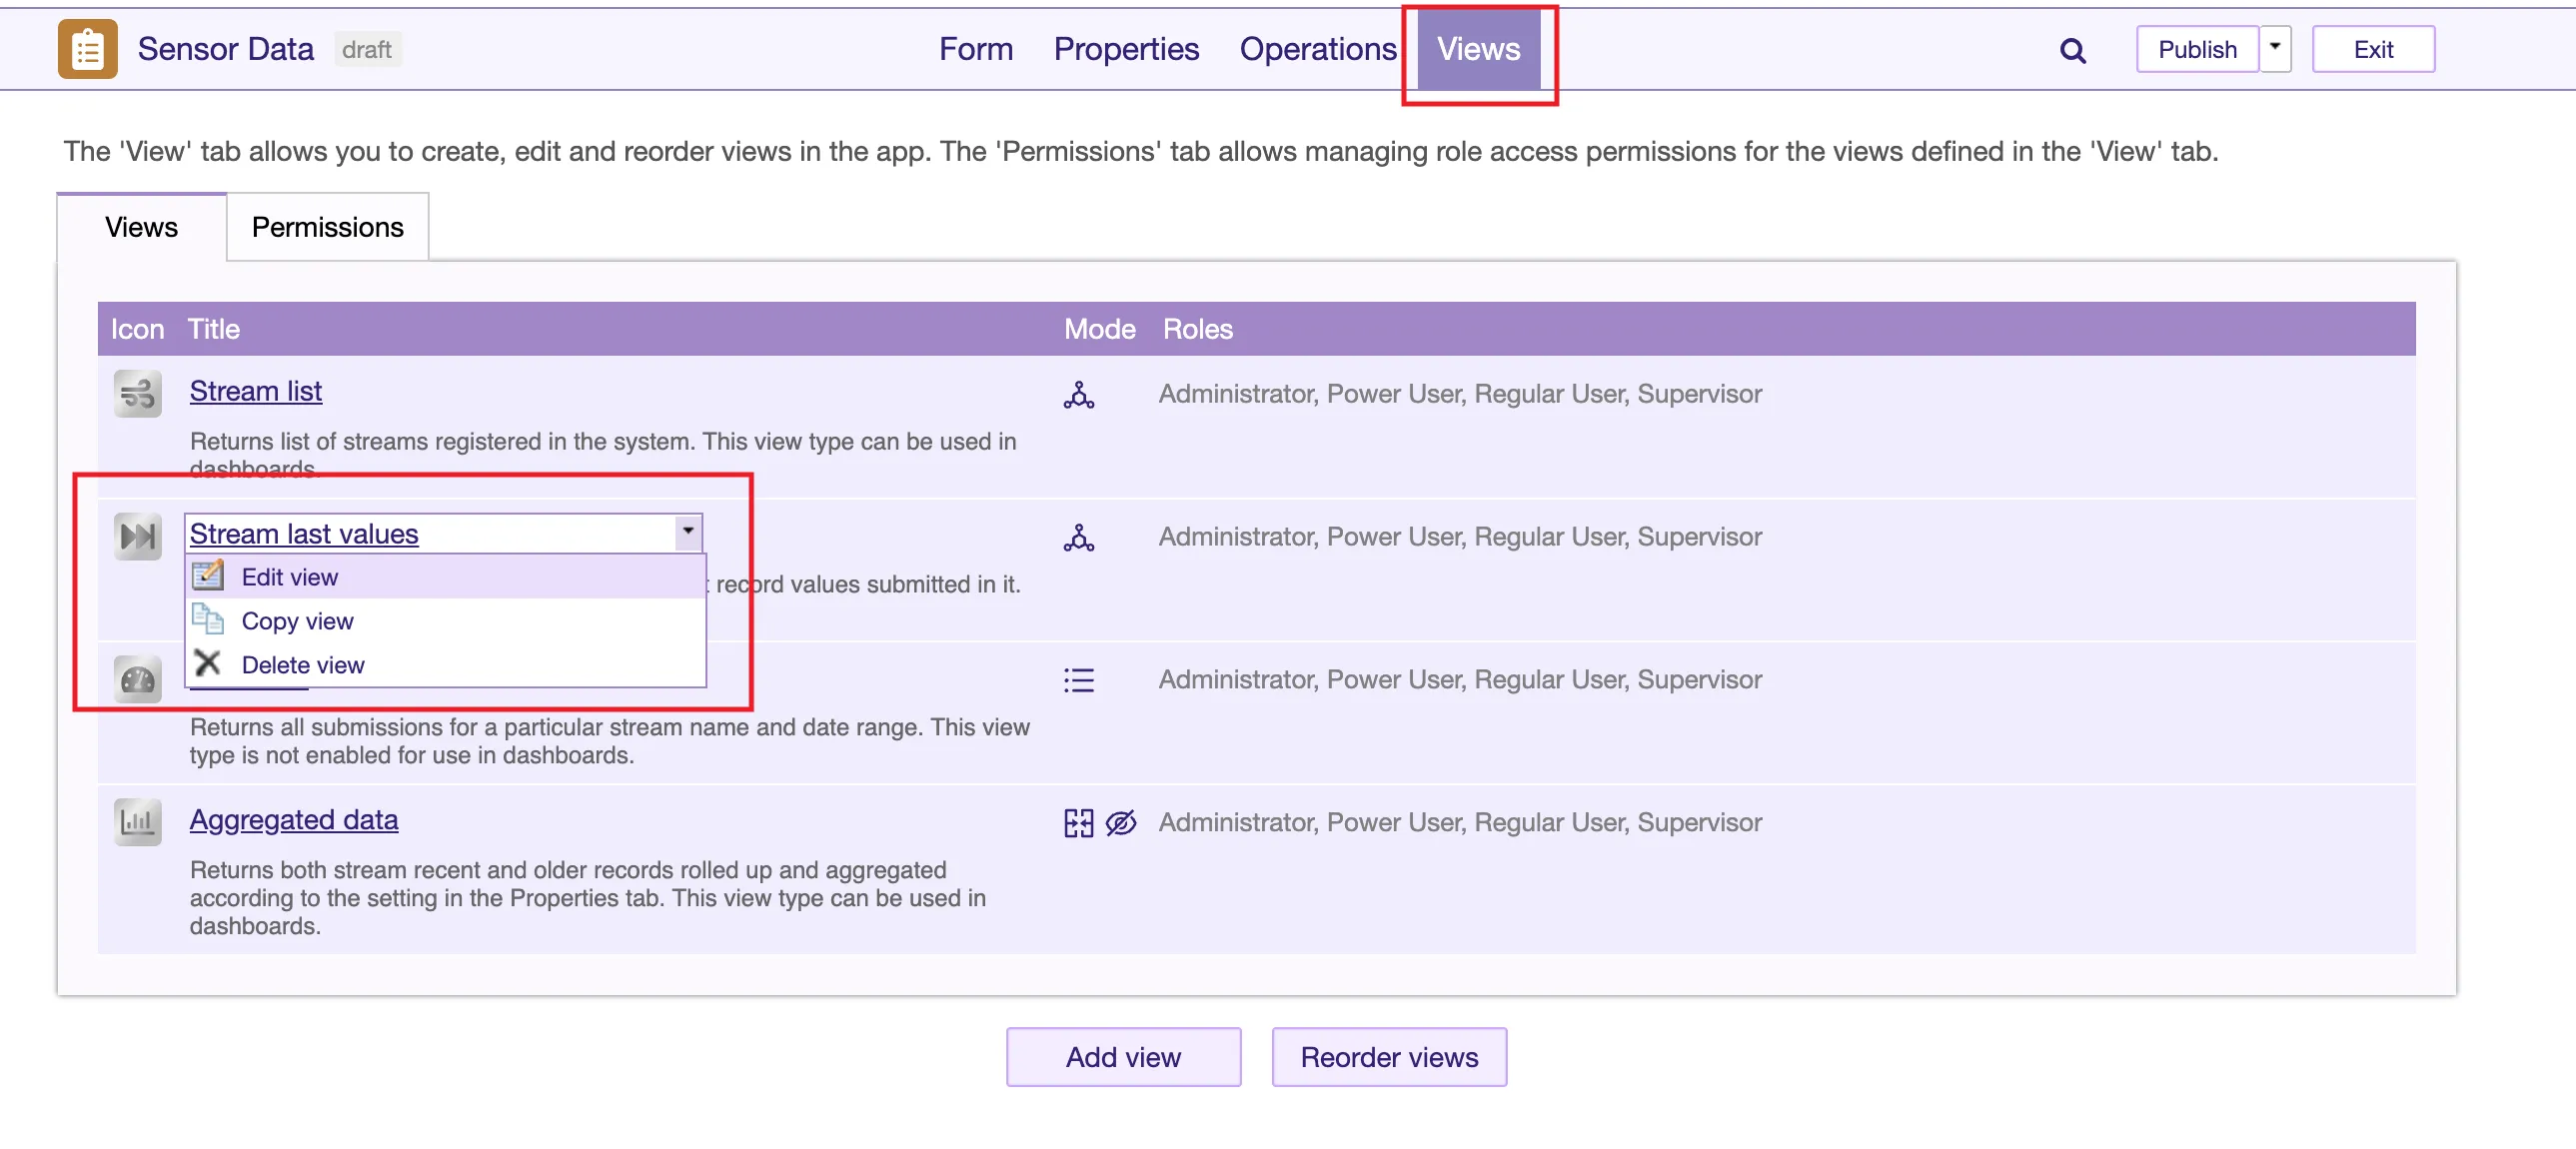
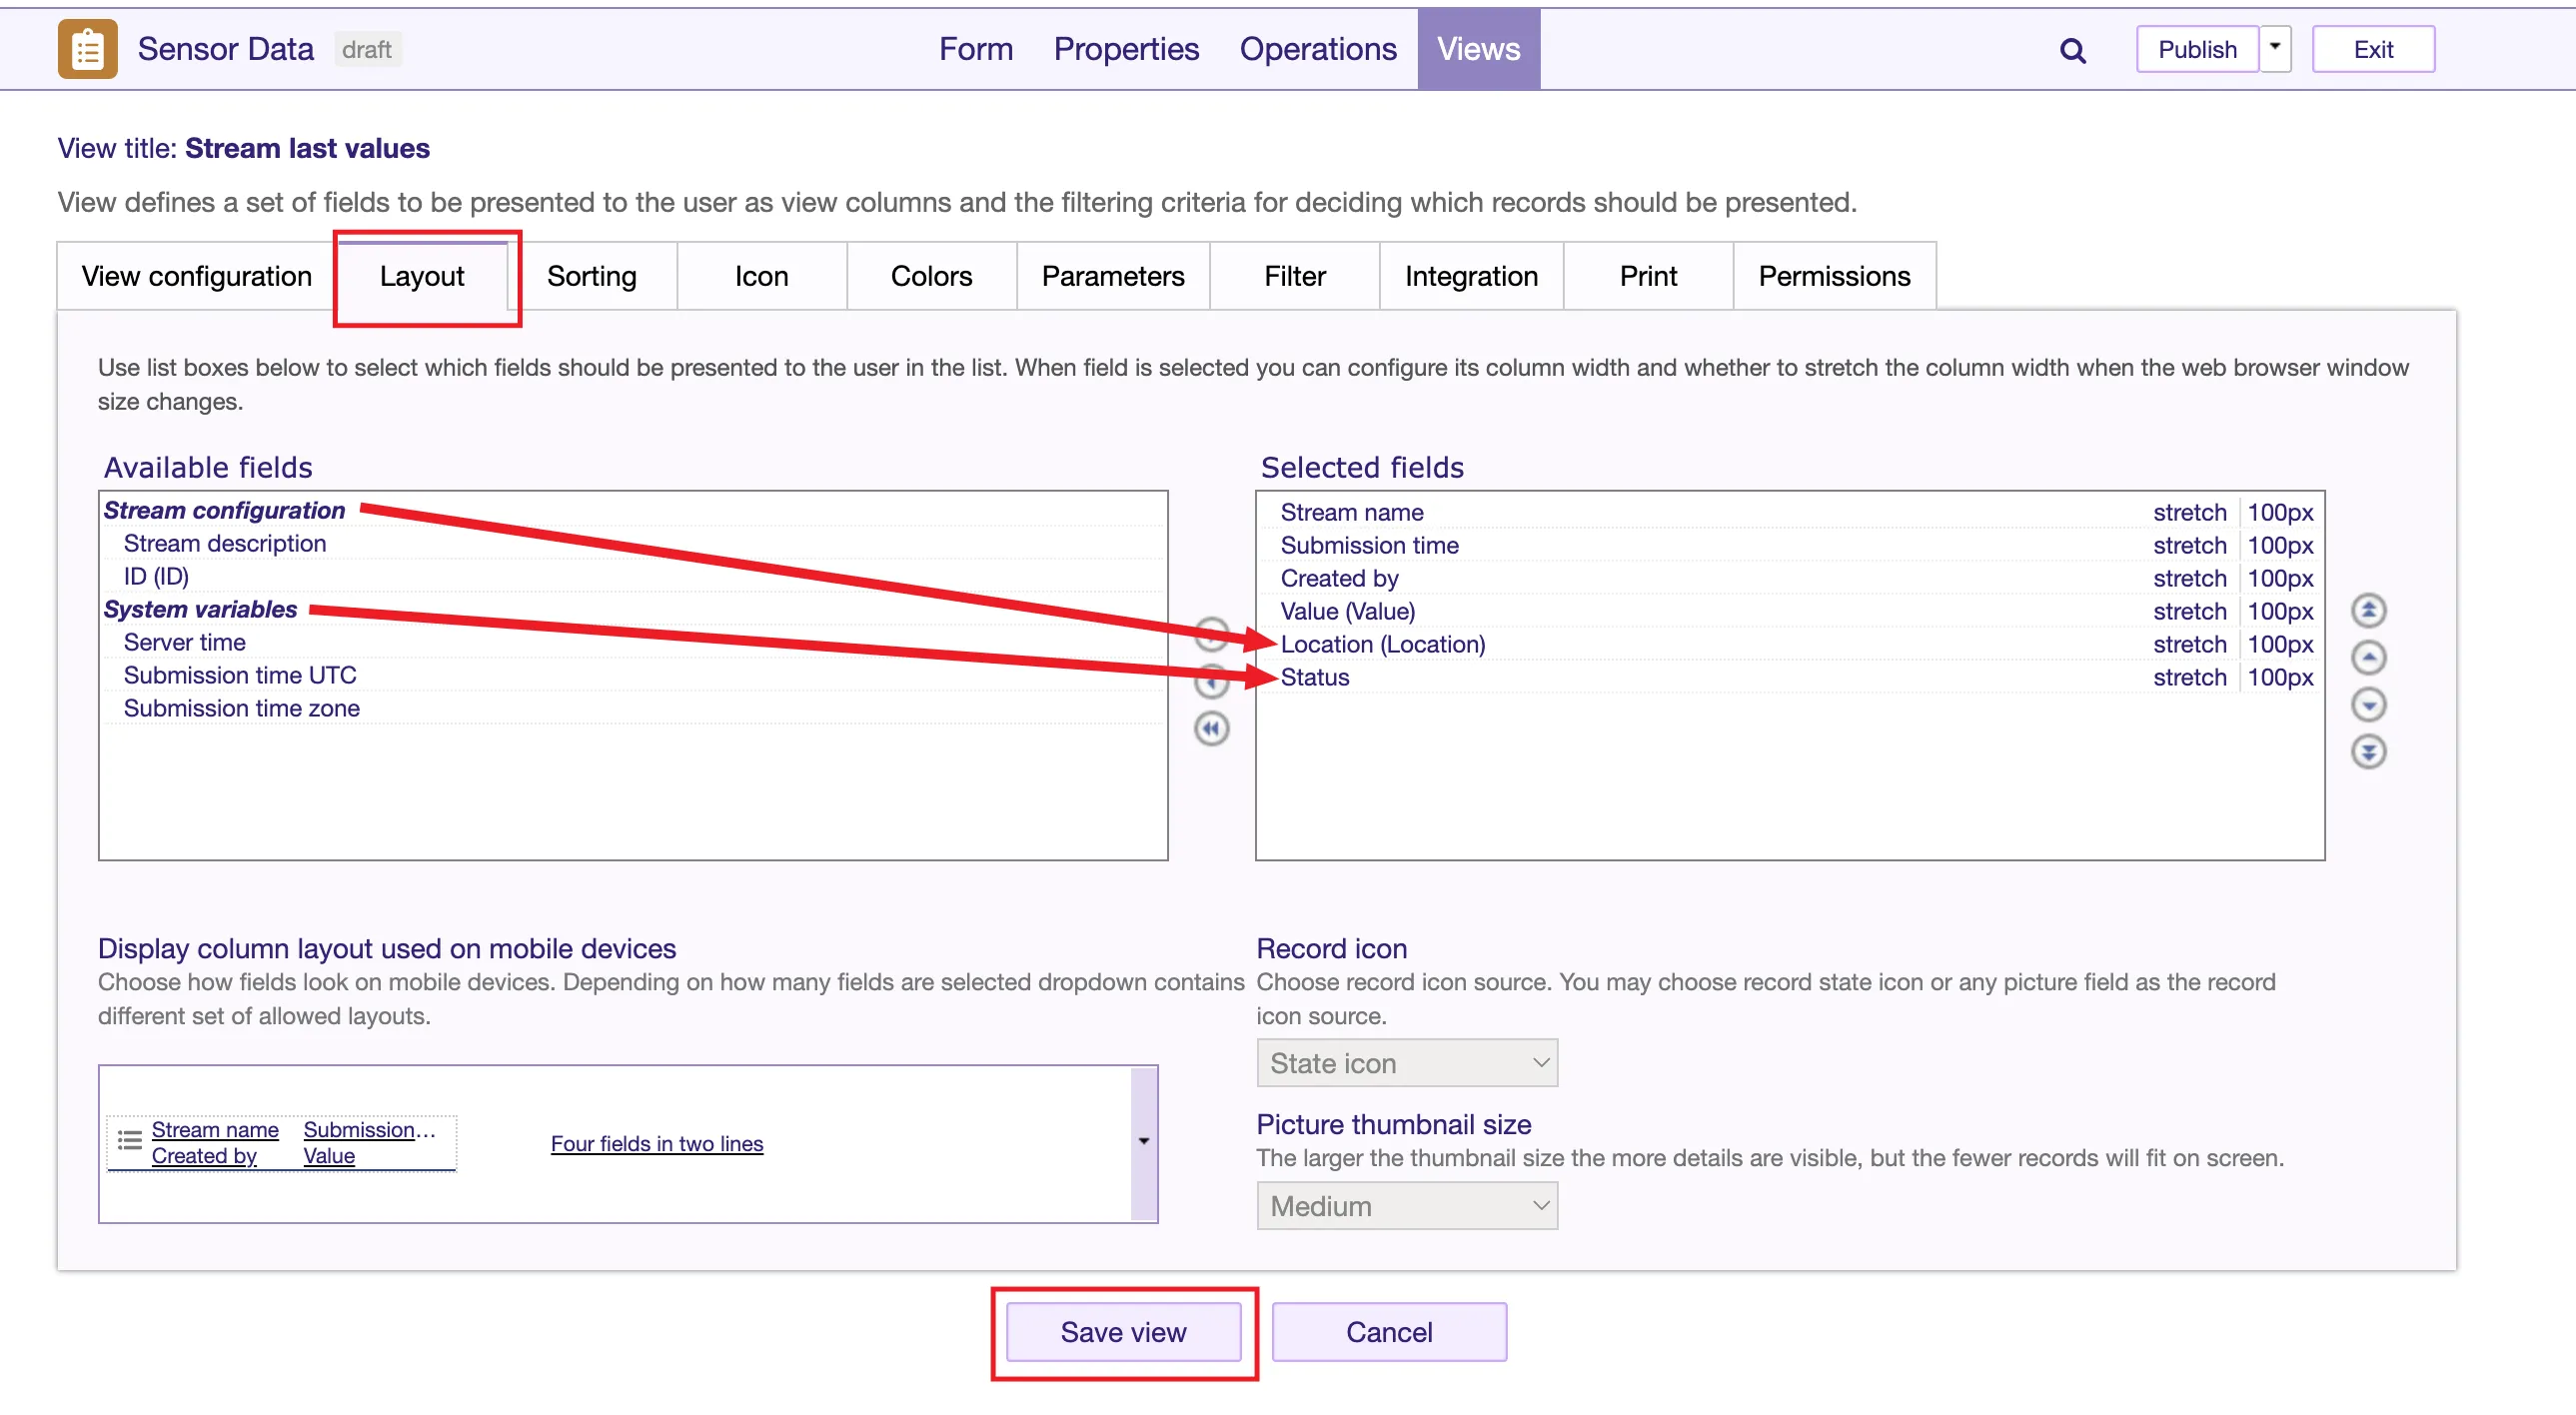
- Lastly switch to the 'Views' section and edit the existing 'Streams last values' view. We will reference this view later as we set up the map in the dashboard.
- We need to add the additional data from the location and status fields so that we can access them in the dashboard widget. Save the View.
- Publish the app. As we created tasks in this app you will need to make sure that you have an available 'robot' user to assign to this app. (Contact support for help adding an additional Robot user licence.)
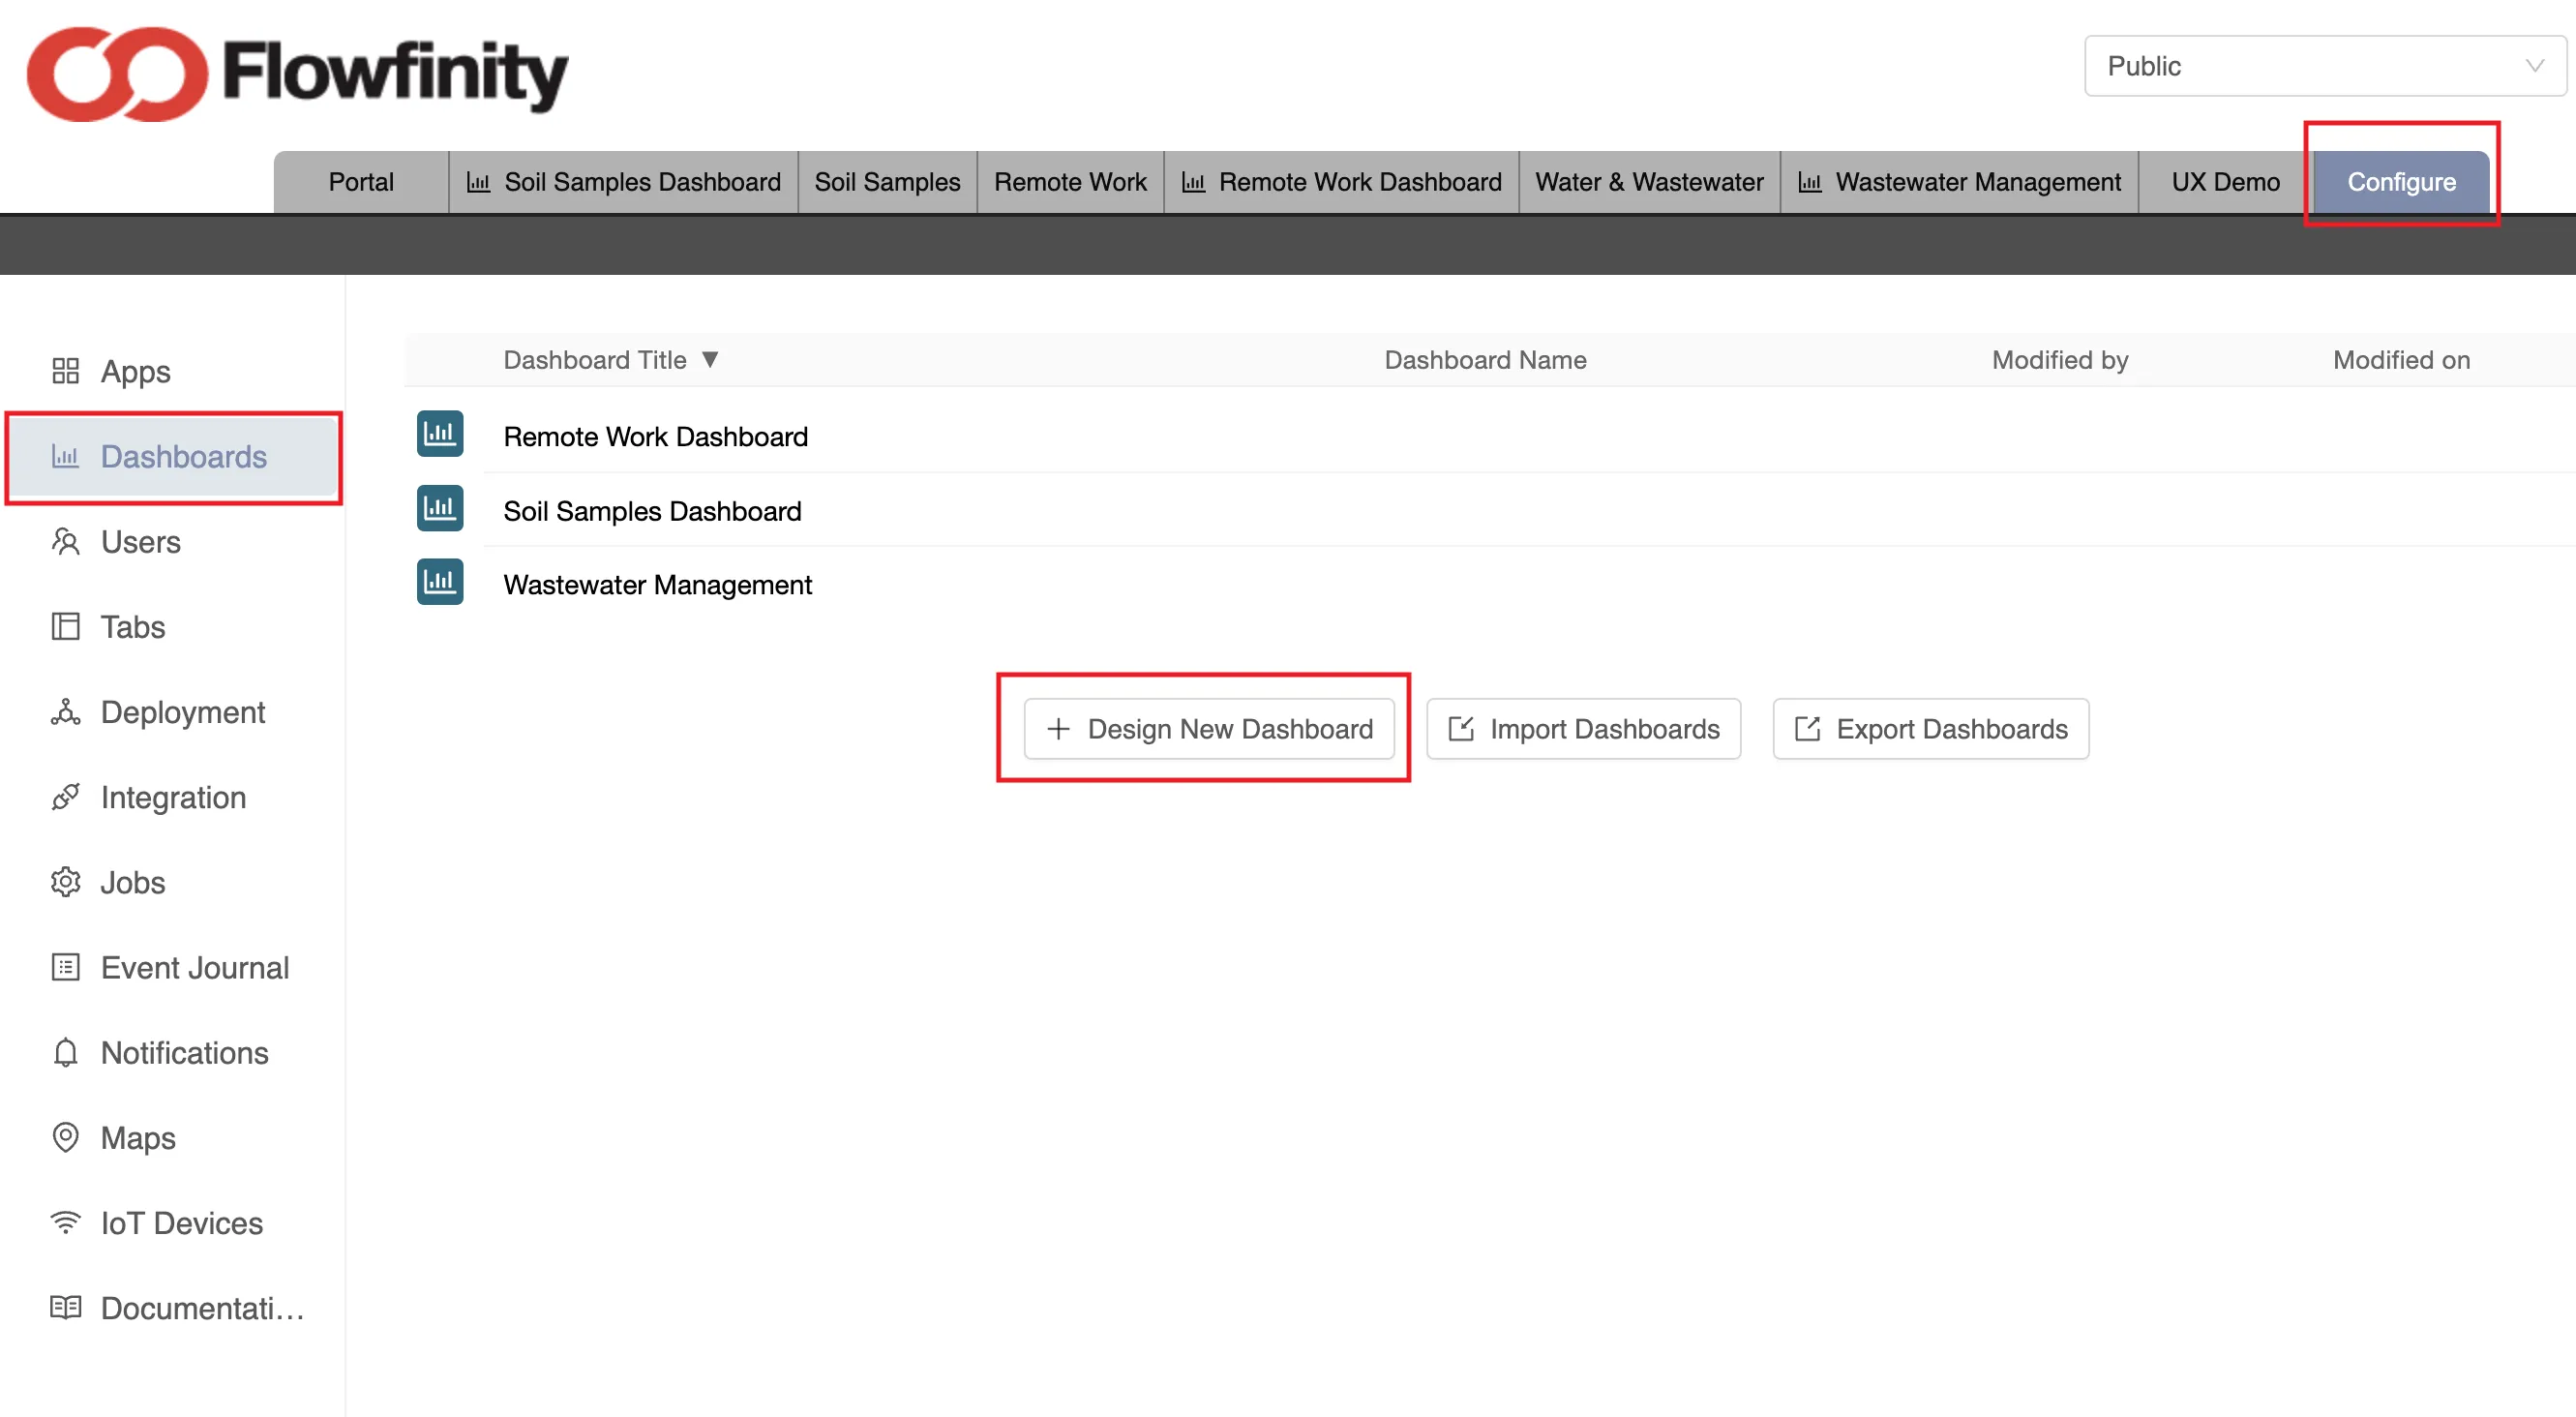
Now we will create (or edit) the dashboard to show the app status on oue map. - Next go to the 'Configure' tab and navigate to the 'Dashboards' section. Click on the 'Design New Dashboard' button to create a new dashboard (or customize the existing dashboard you want to have the map in).
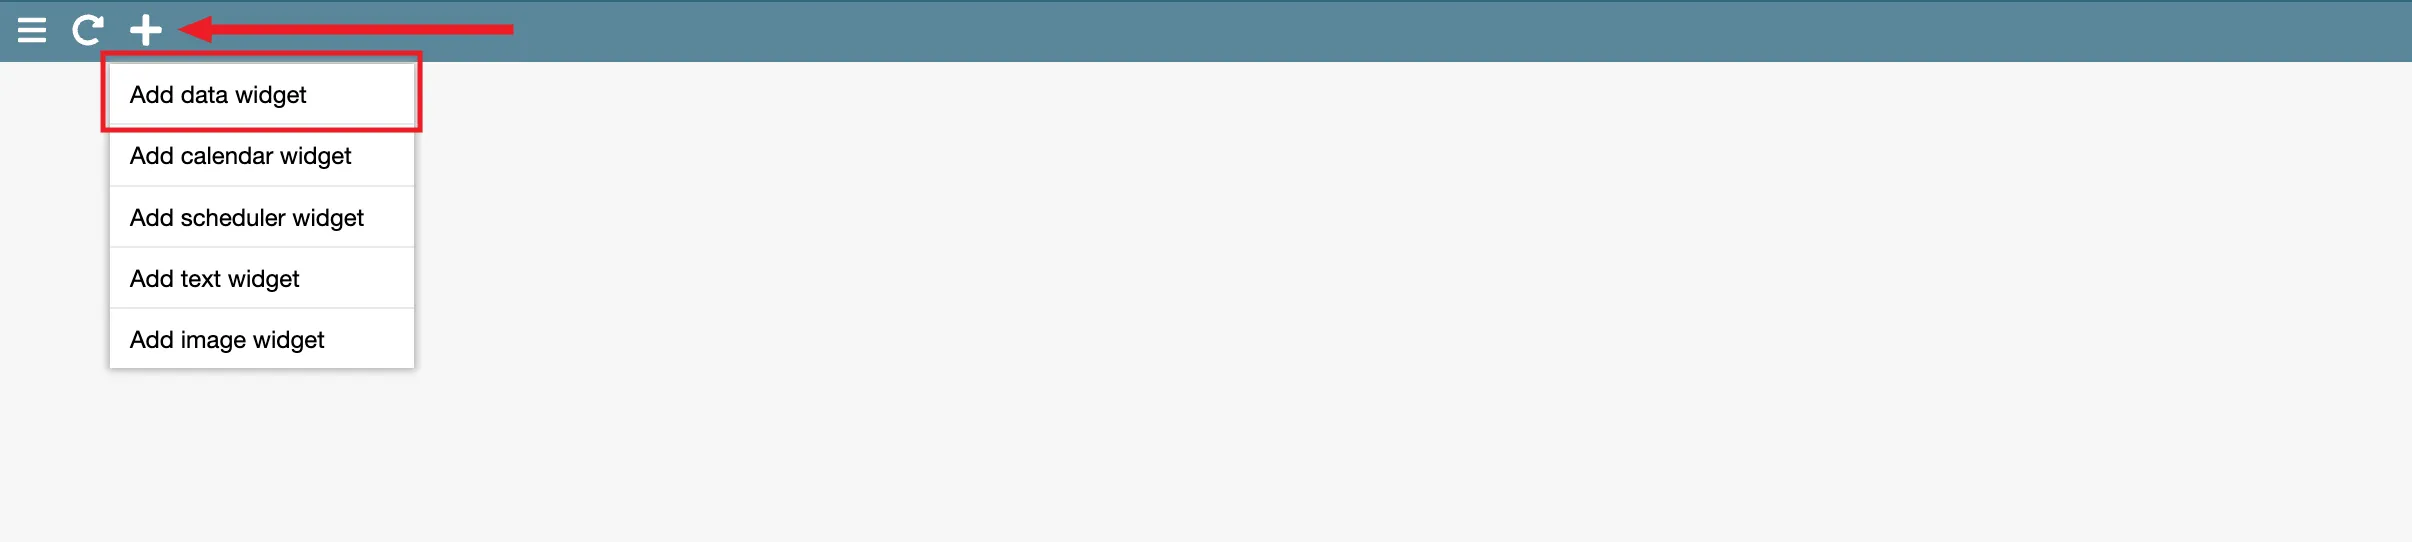
- In the dashboard click on the '+' symbol on top left, and then select the 'Add data widget' option.
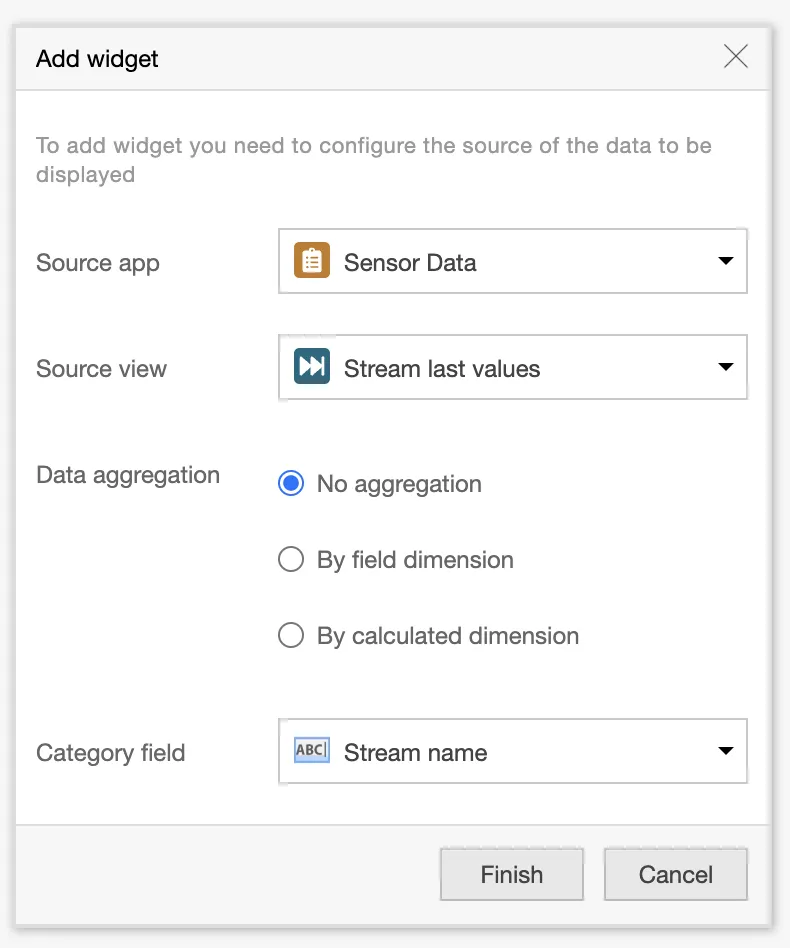
- In the 'add widget' popup select the 'Sensor Data' app, then in the source view select the 'Stream last values' view. Set 'Data aggregation' to 'No aggregation' (we will be displaying unique last value for each stream, so there is nothing to aggregate) and then select the field you want to use as a category for this widget (Stream name). Click 'Finish'.
- This will create a new widget in the dashboard that will by default present the data from the 'Sensors' app in tabular format.
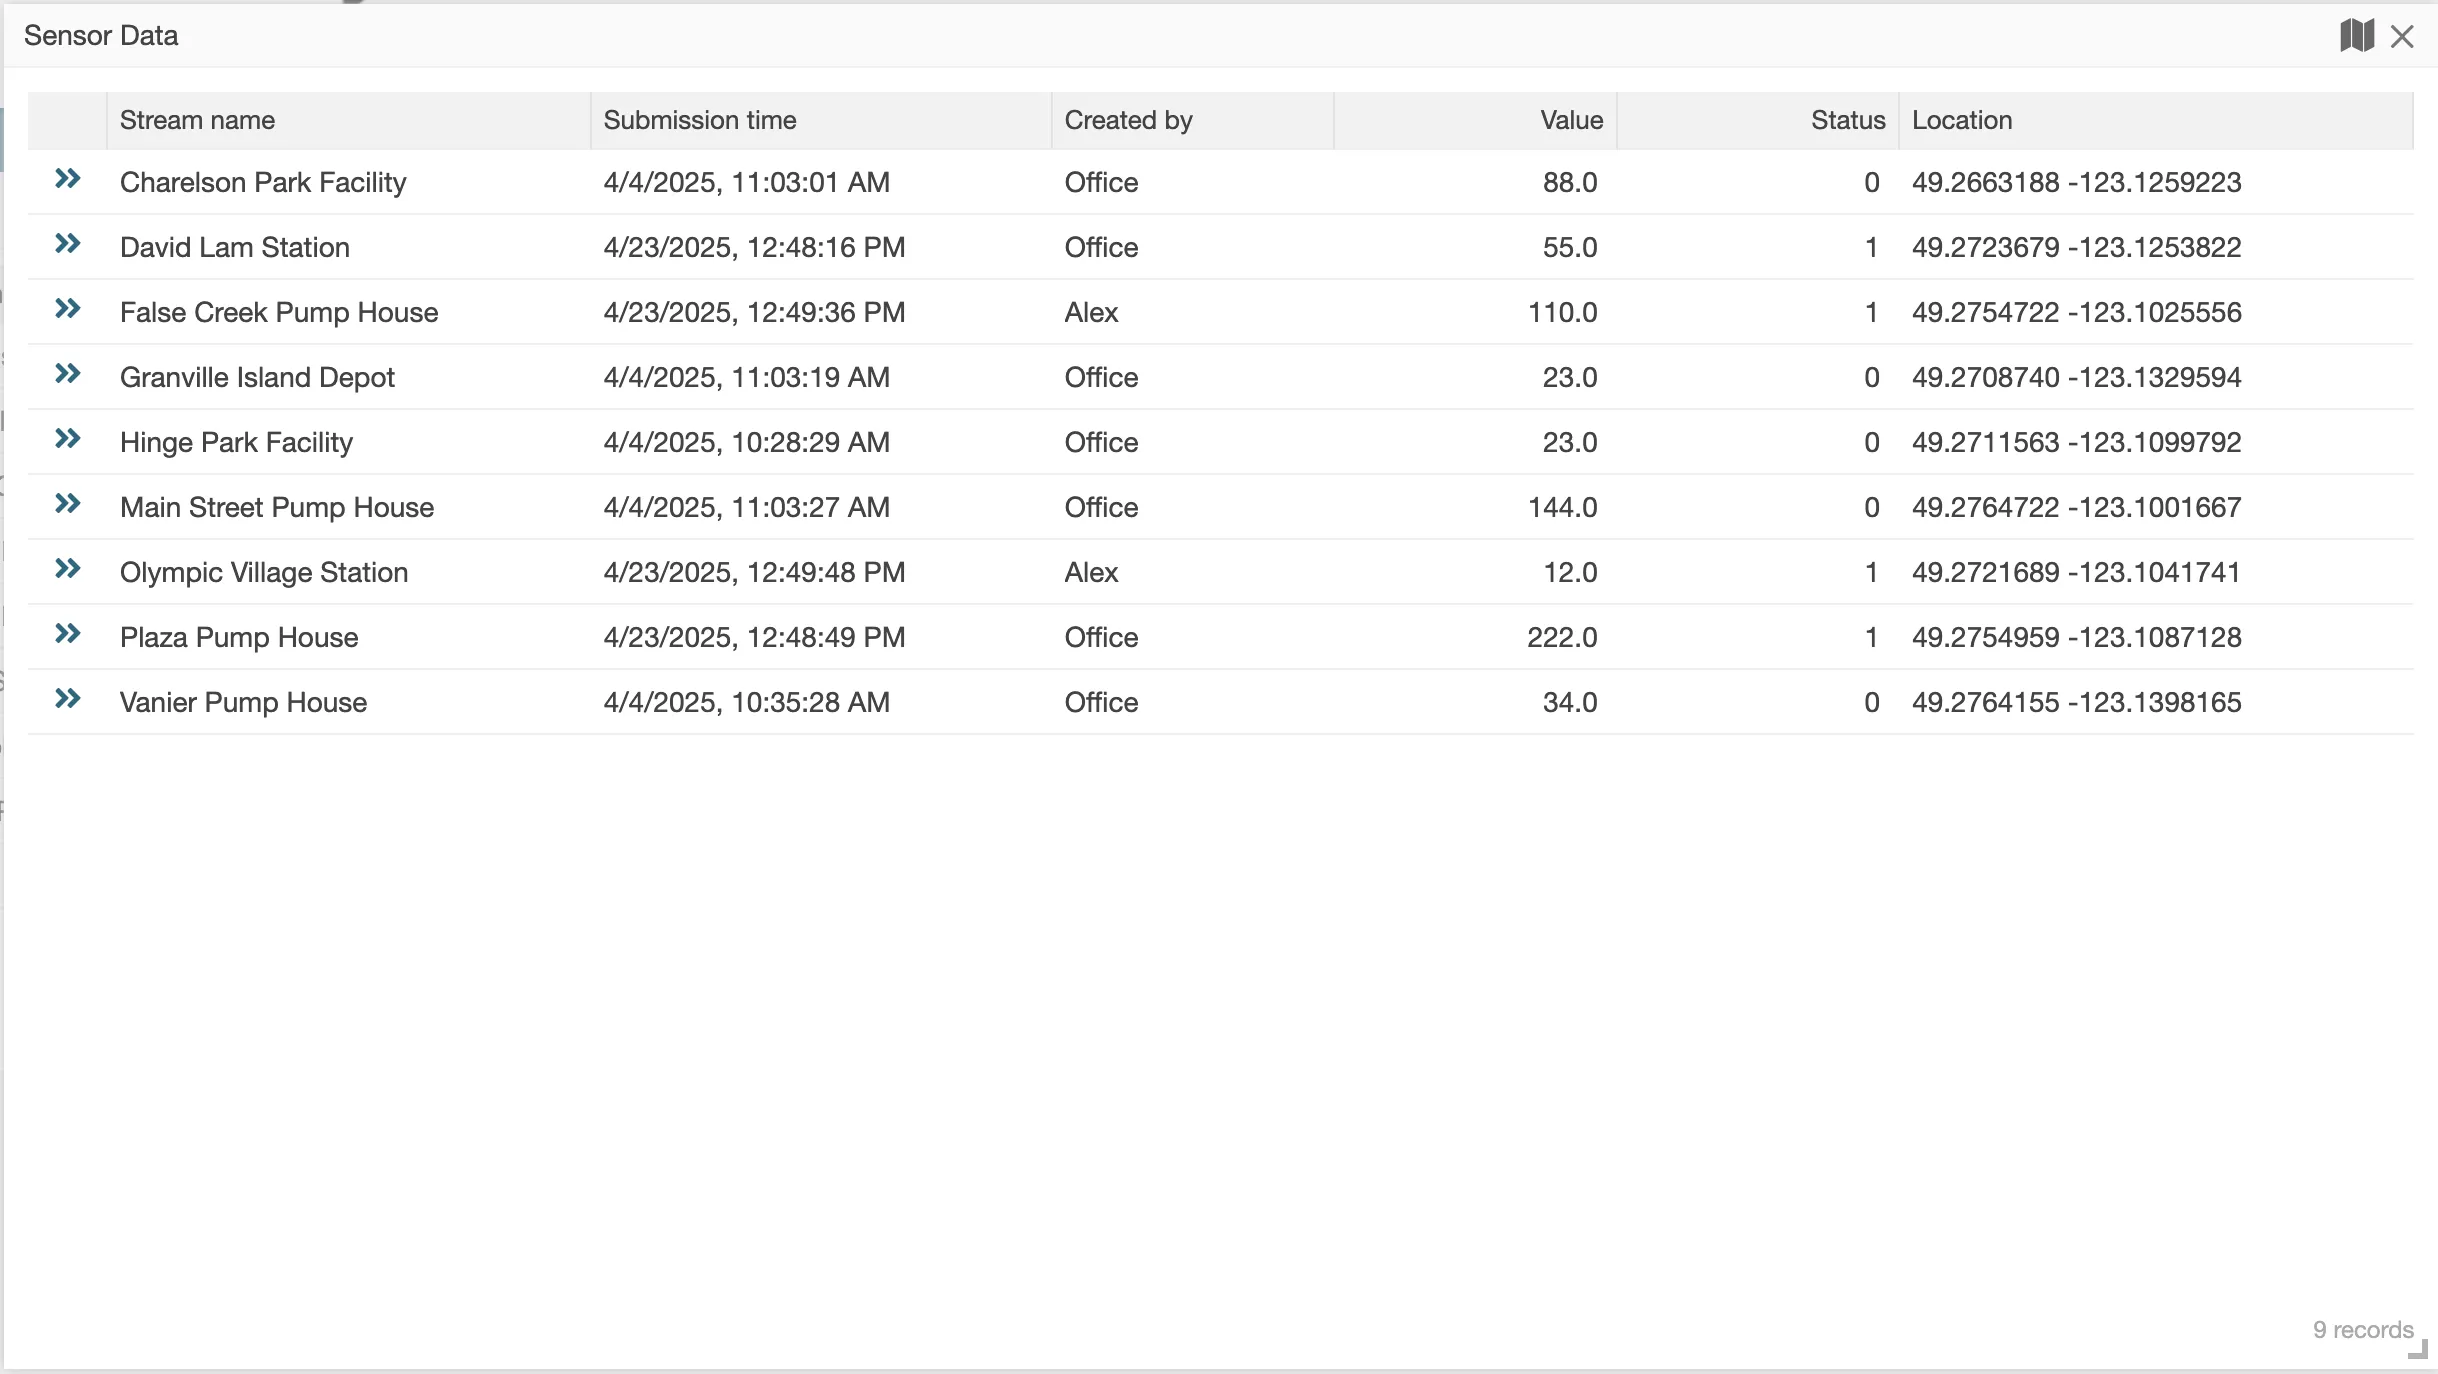
- As long as there is a location field in the content displayed in the widget you can switch to a 'map' presentation by clicking on the 'switch mode' button at the top right of the widget, to the left of the maximize button.
The first click will toggle the widget to a 'chart' mode and second will switch the widget to 'map' mode. While in map mode you can freeze this mode by right clicking on the widget to access widget properties and checking only the desired display modes.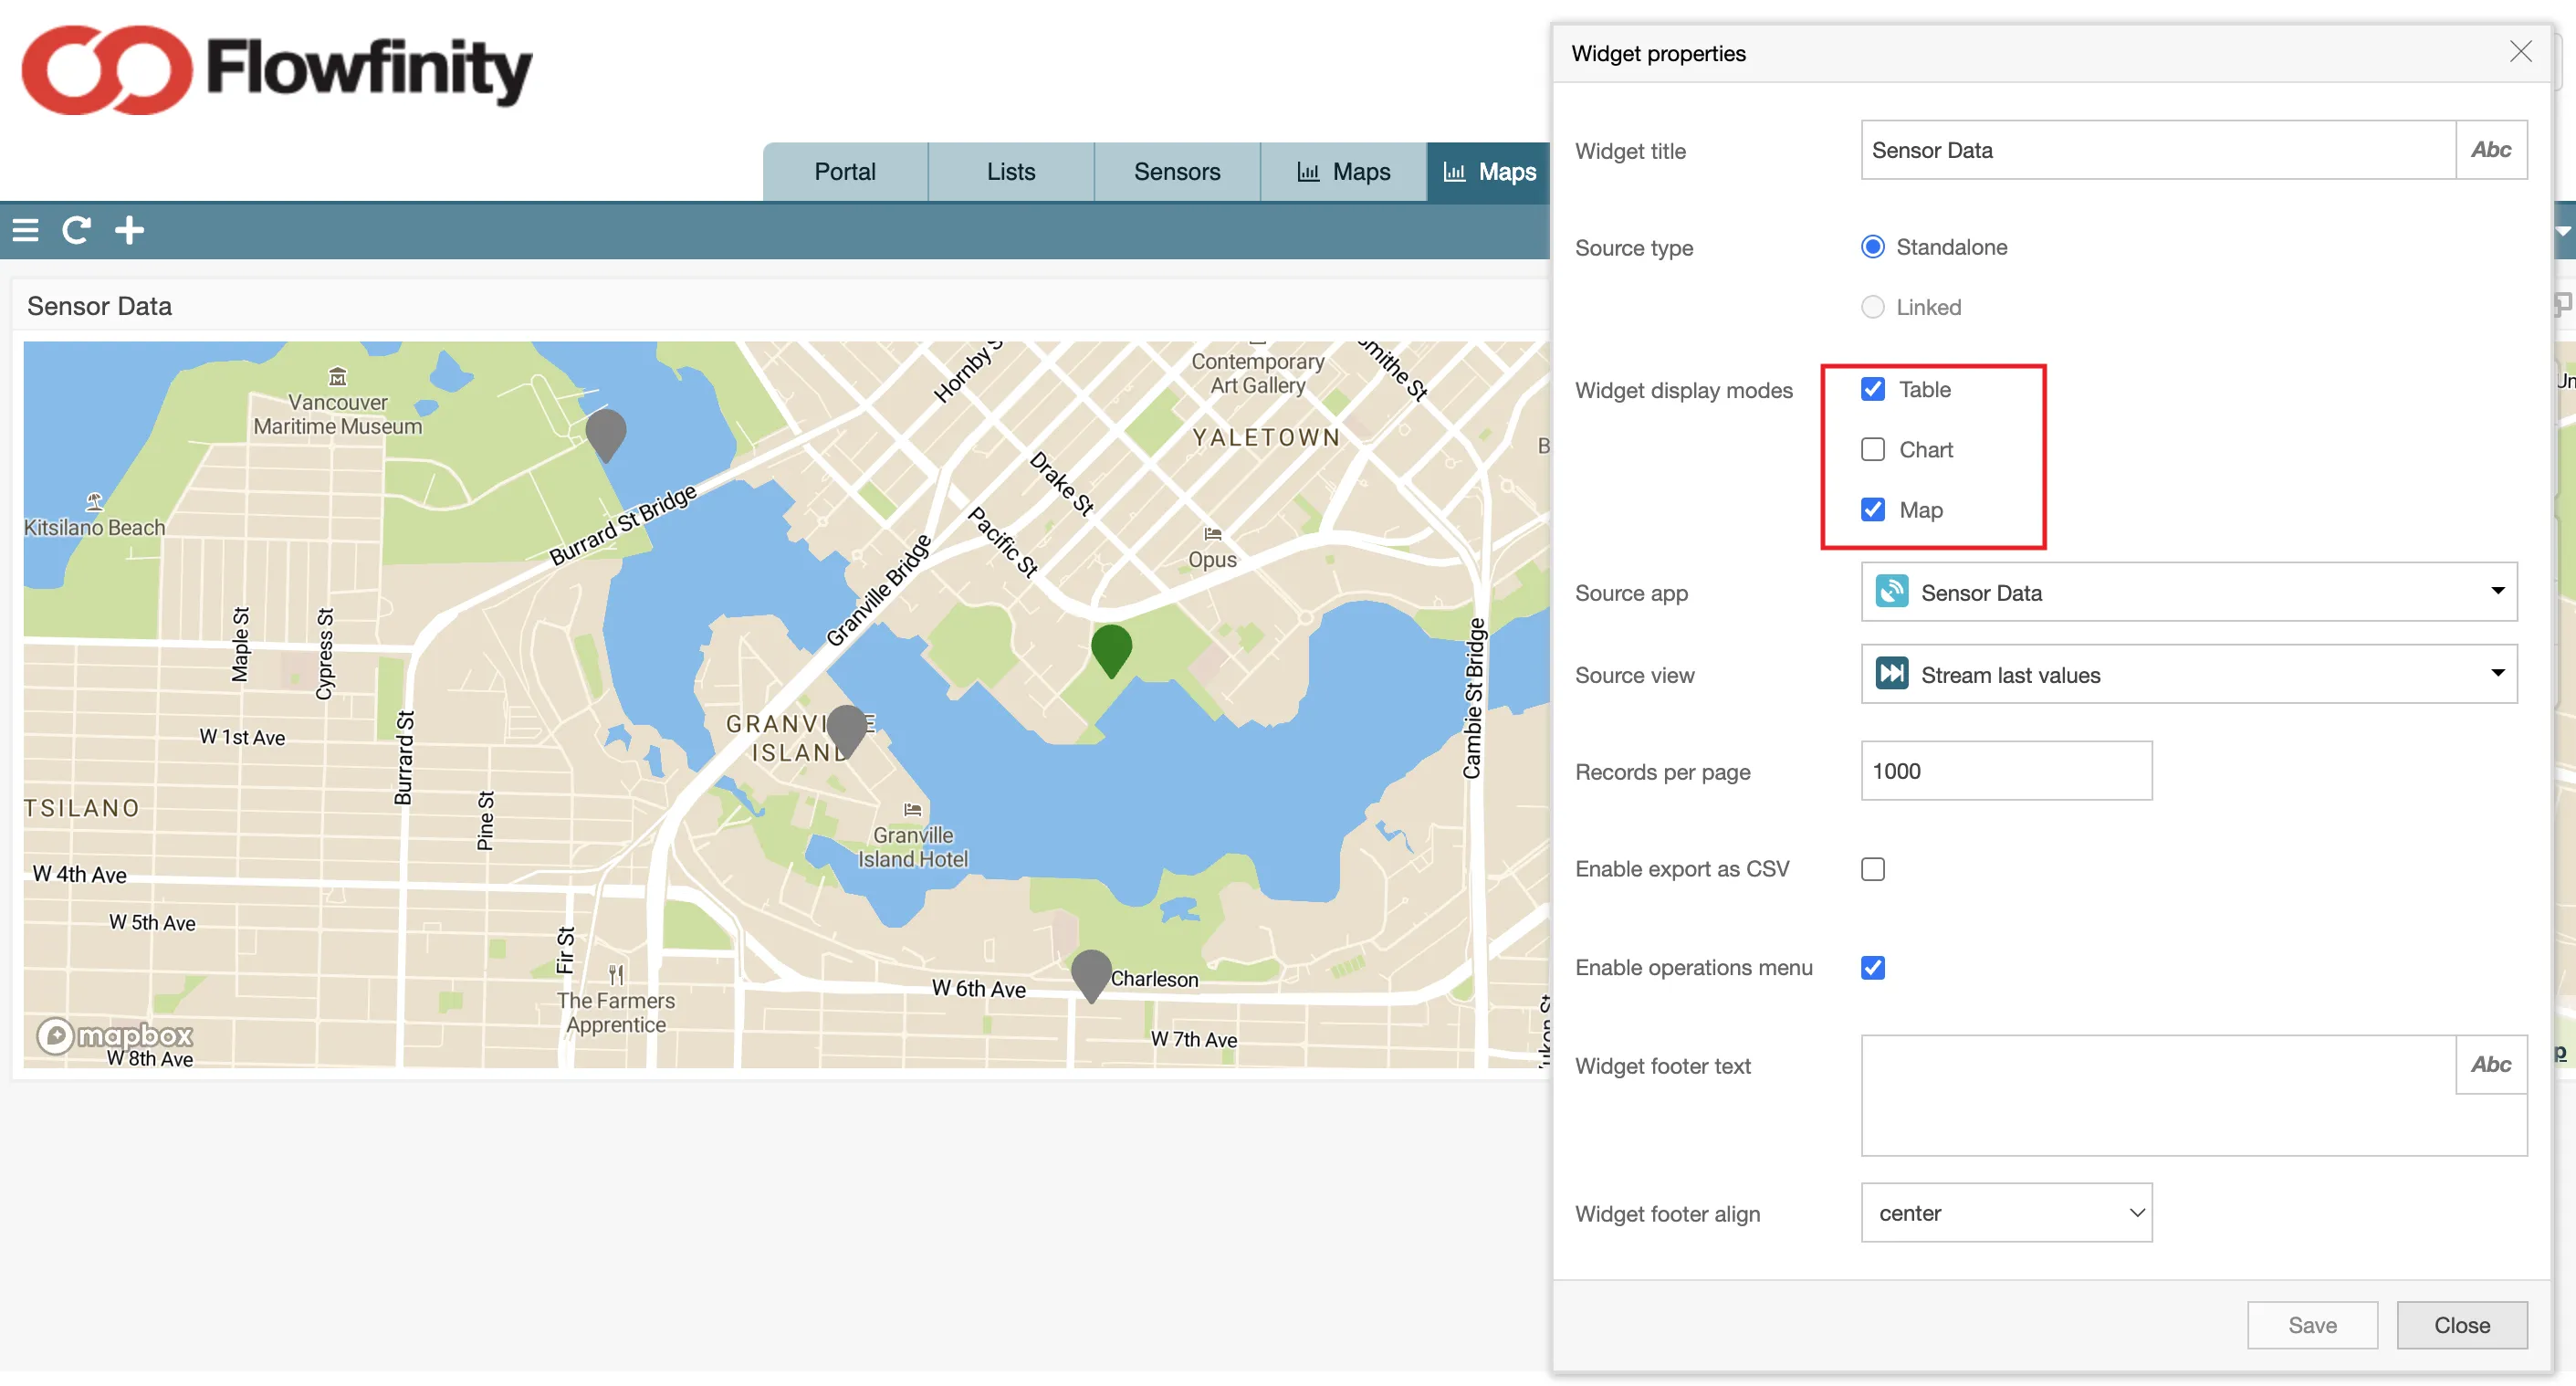
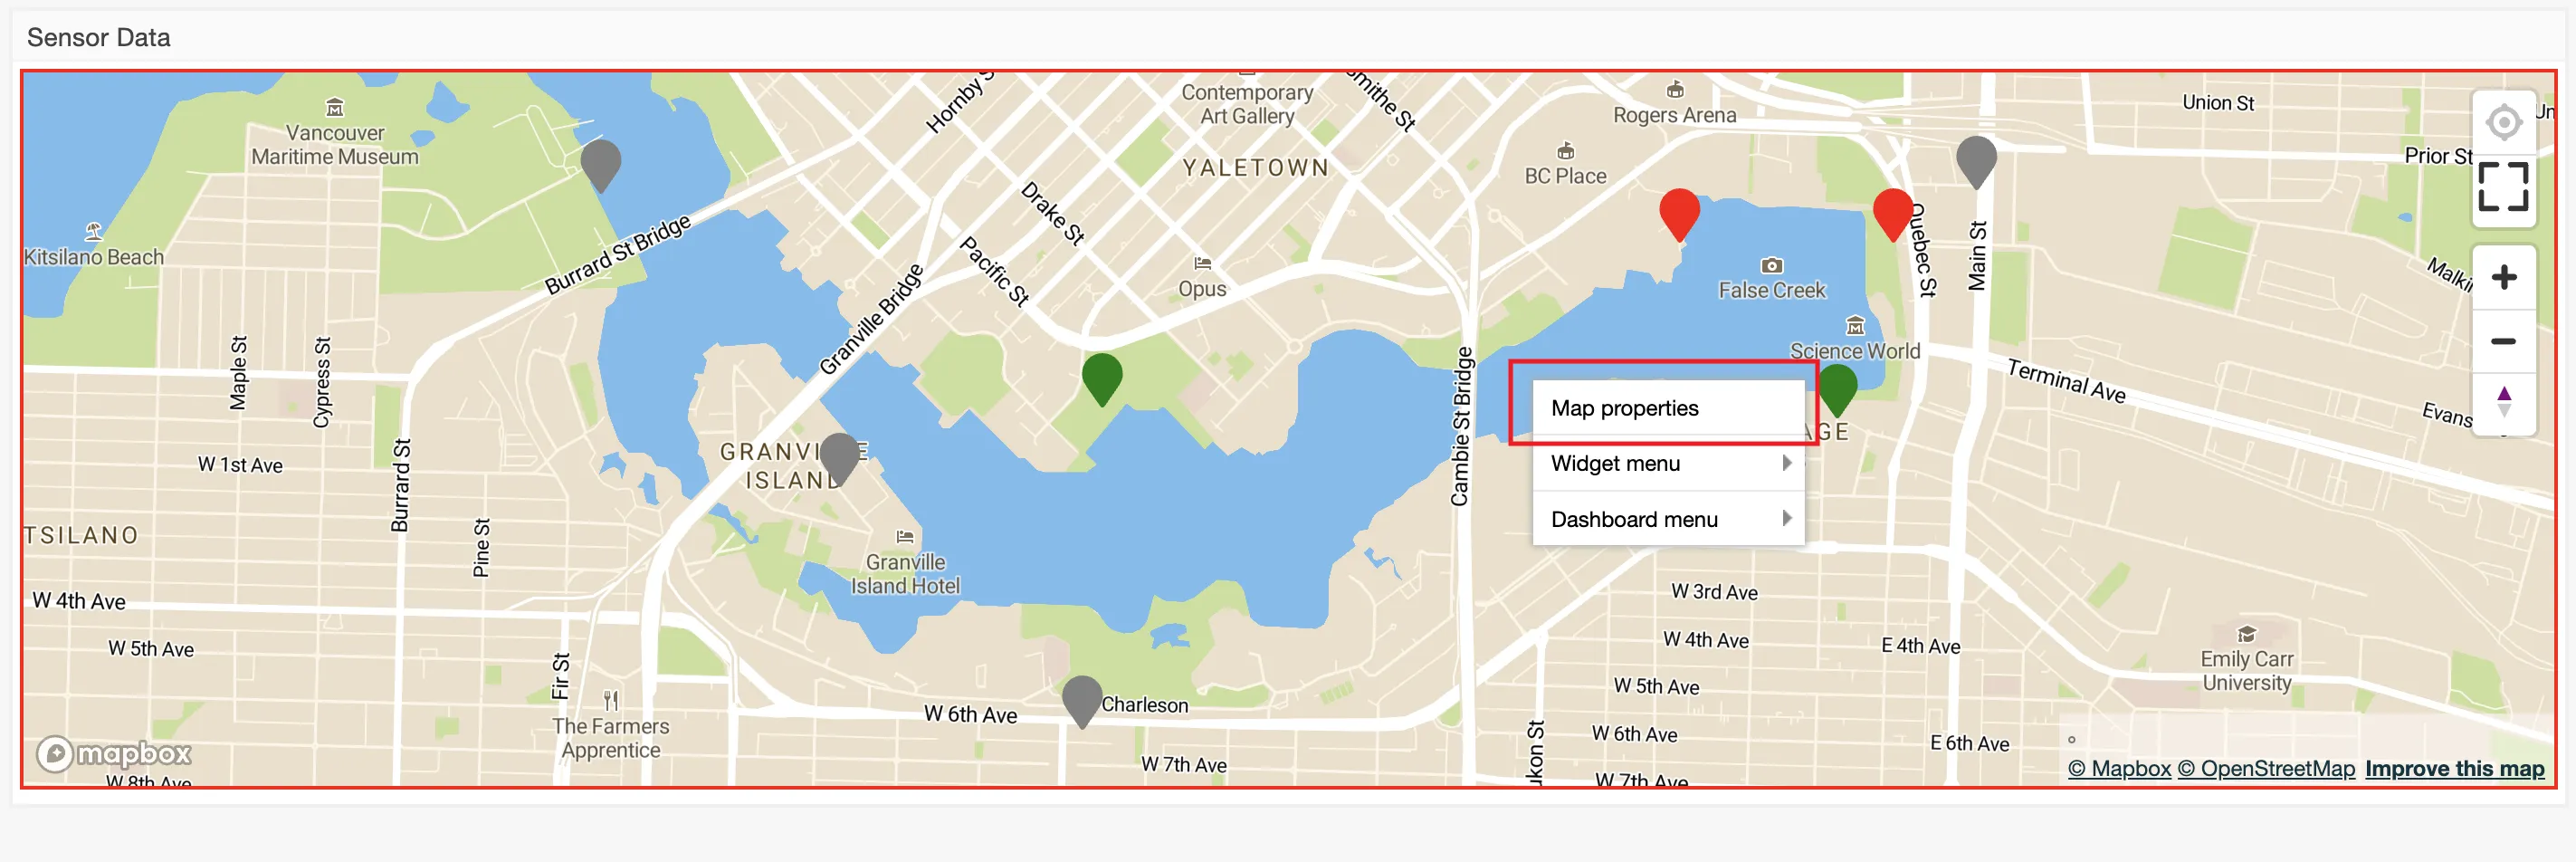
- To change the colors of the pins based on the status of the sensor you need to right click on the map to open options dropdown and then select 'Map Properties'.
- In the properties pop up click on the 'pen' icon to the right of the 'Display locations' field selection.
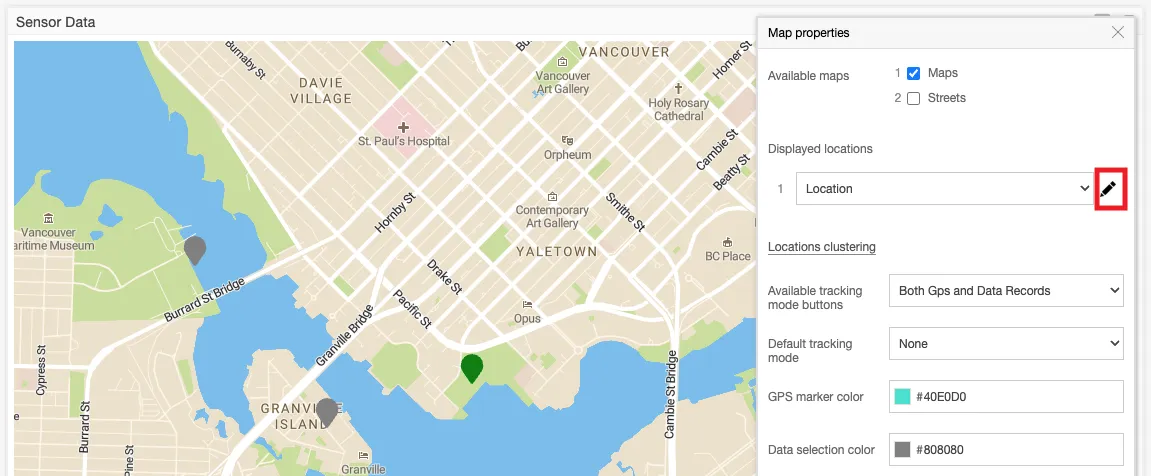
- In the location marker popup you can control the icon style and color on the map, both can be changed based on the data from the stream using formulas.
Change the 'color mode' to 'Calculated color' to gain access to the 'color formula' setting where you can configure a formula to assign what colors should be used for the icon.
We'll show a gray icon if the sensor status is 0 (sensor offline), red when sensor status is 1 (online) and the value is greater than 100, and green when sensor status is 1 and it's value is less than 100 (our optimal sensor reading).
You can copy these settings or modify to your own specifications: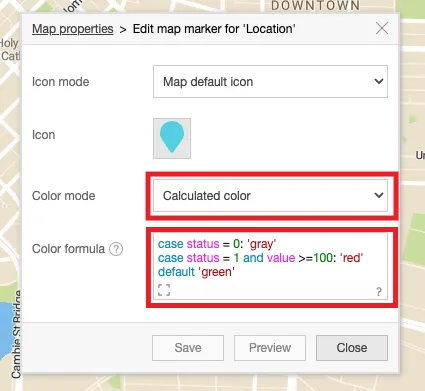
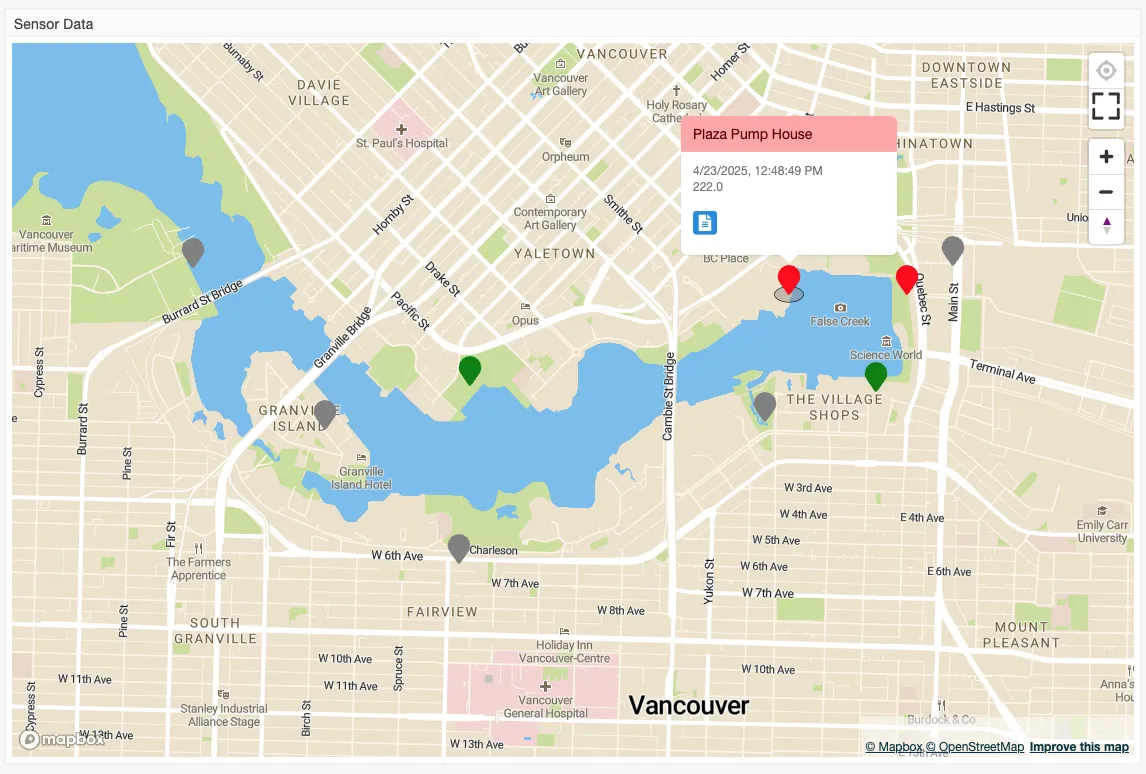
- Save the changes and the map will look similar to this:
- All done! For more help configuring Streams or Maps please contact our support team.